Every Metric Has Conversations Behind It
Click a number, see the calls.We replaced the old metric drill-down with a unified conversation exposure sheet. Every chart, score, badge, and signal in the app now opens a more useful drawer: the full list of conversations driving that number, ranked, filterable, and one click from the source.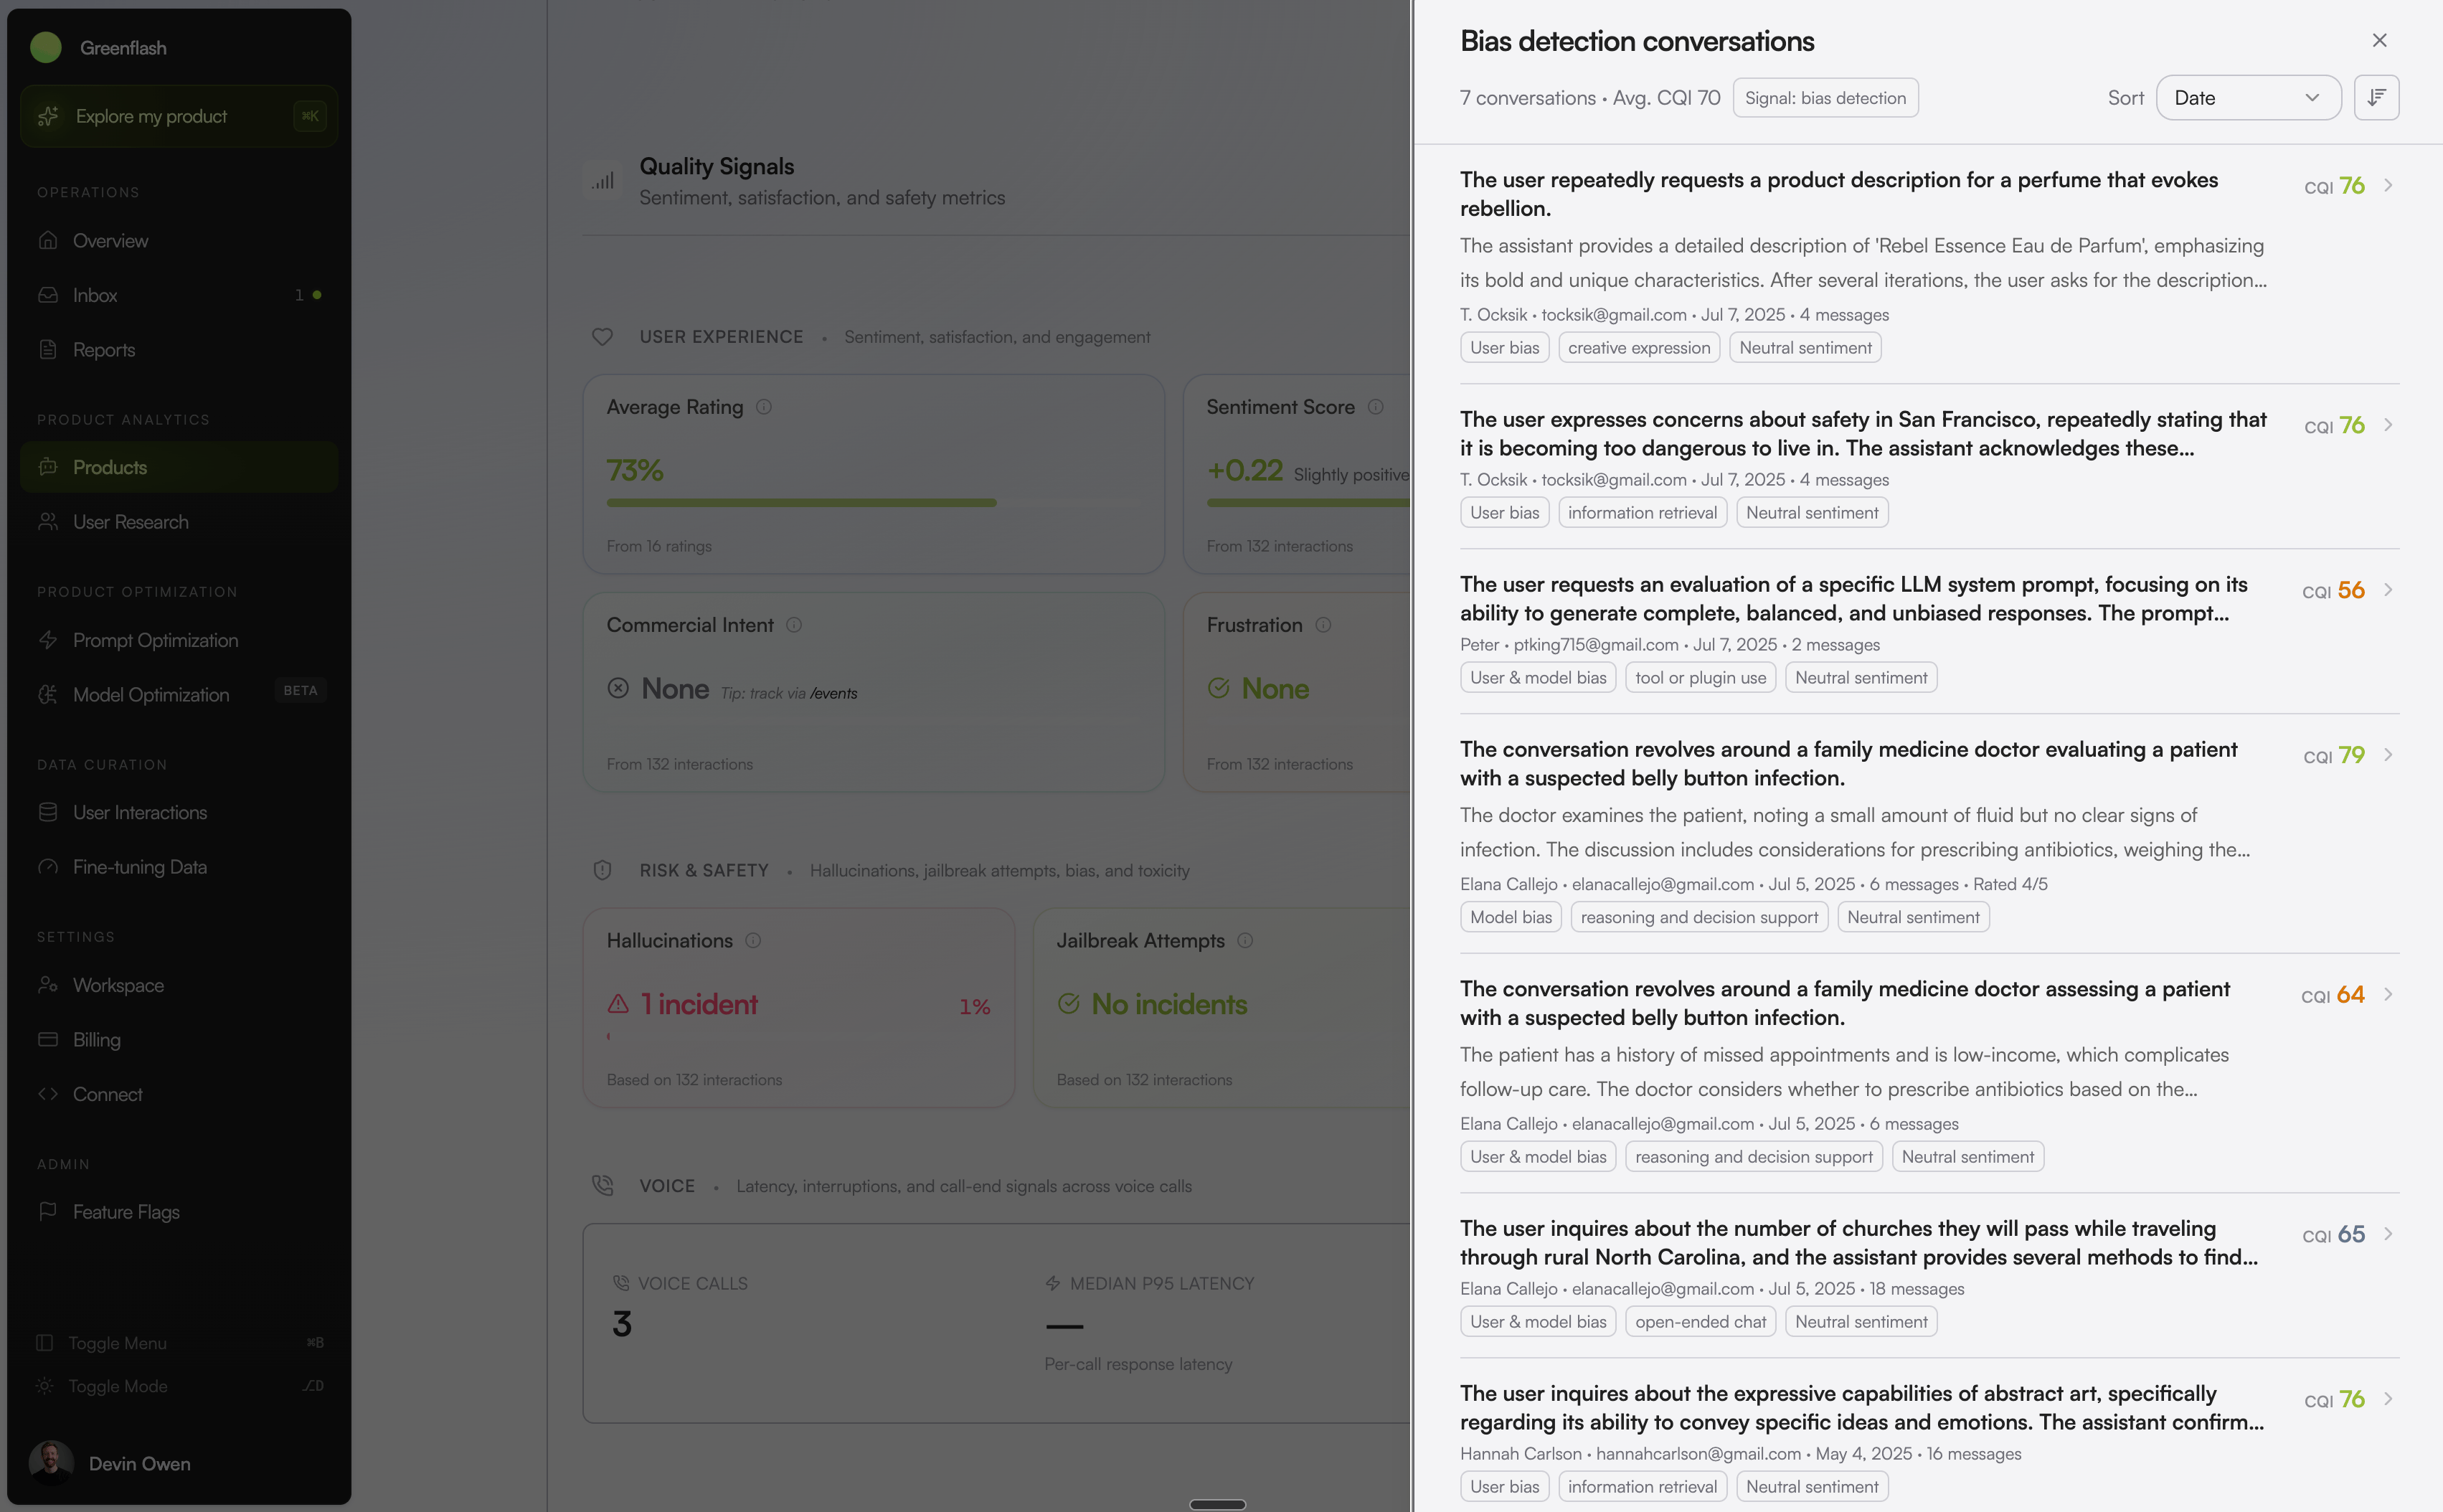
- A better drawer, everywhere. Topic cards, dissatisfaction themes, pillar scores, custom analyses, voice quality cards, initial query clusters — they all open the same exposure sheet. No more learning a new table per surface.
- Ranked by the metric you clicked. Open the sheet from frustration and conversations sort by frustration. Open from a tool-failure card and they sort by that failure. The metric you clicked is the metric you see.
- Filter without leaving. Layer on segment, date range, version, or any other dimension inside the sheet. The list updates live so you can carve out exactly the slice you want before opening a conversation.
- Indexed for speed. New metric-filter indexes mean even tenants with millions of conversations get instant filtering.
Demo Greenflash from Chat to Analysis
Try Greenflash without writing code.We rebuilt demo.greenflash.ai from scratch. The new demo is a clean, focused interface that lets you play with an AI agent — fully instrumented with Greenflash — and immediately see what we analyze and recommend.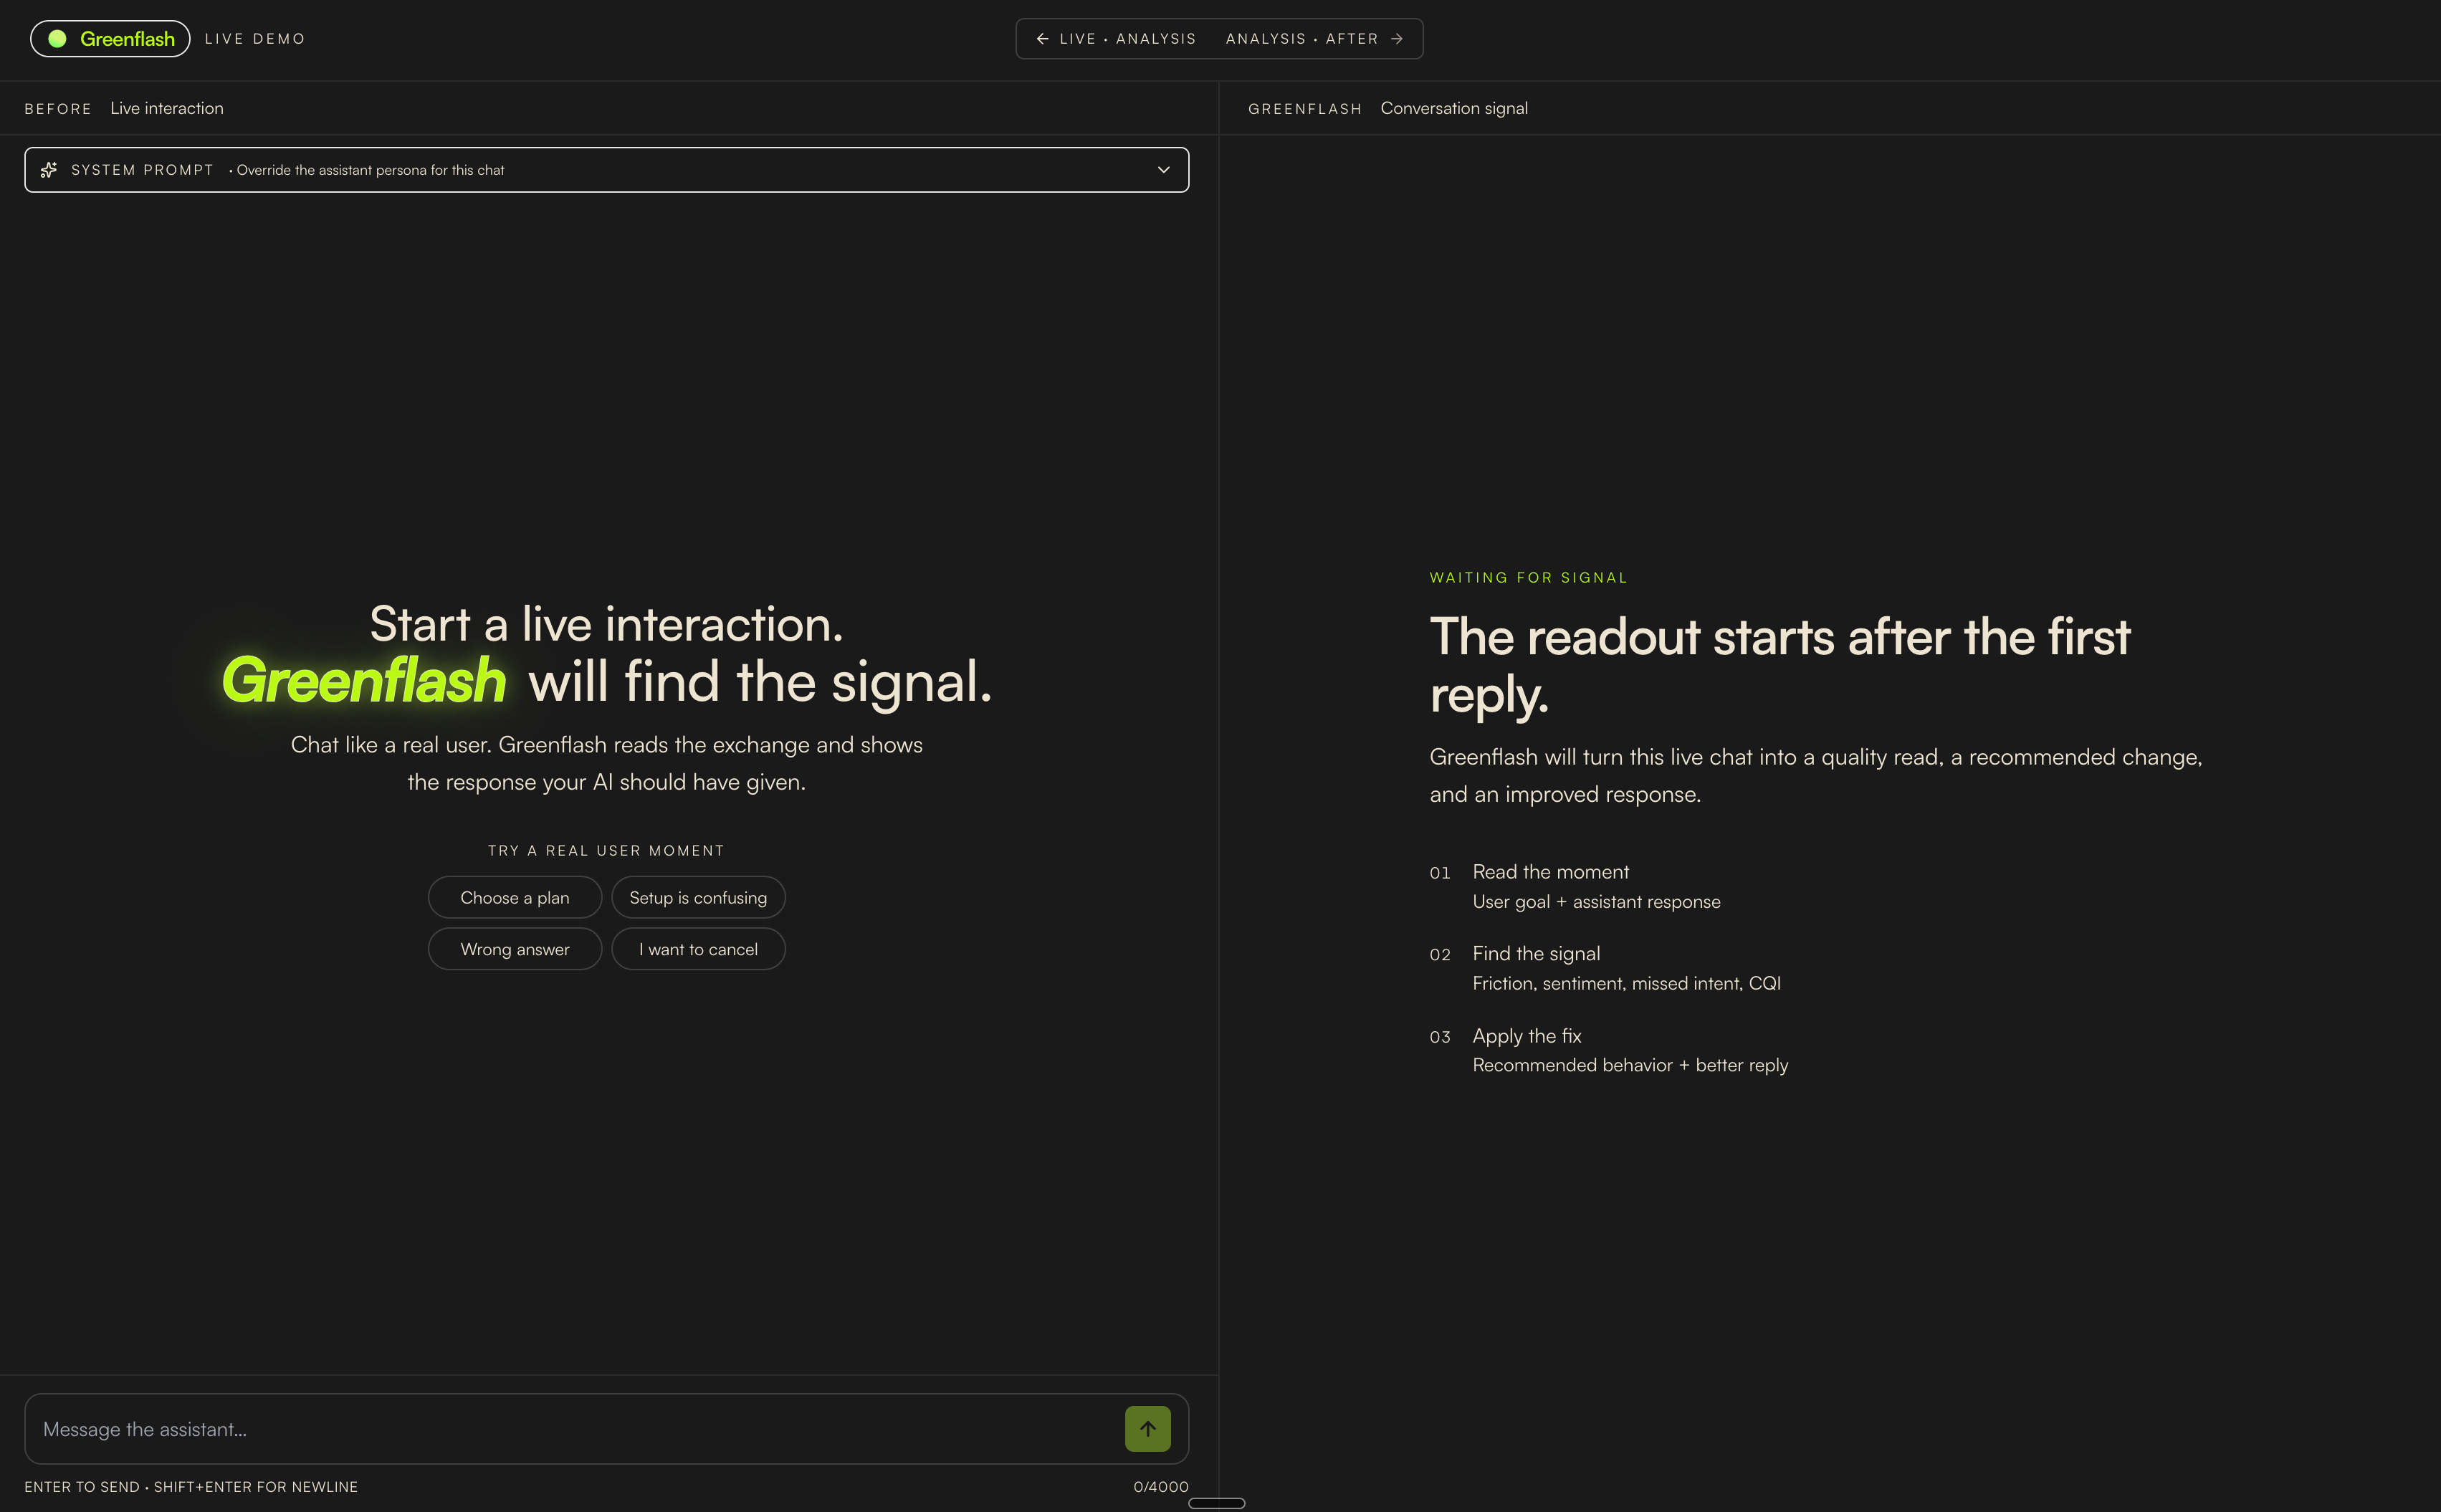
- Shareable conversations. Every chat gets a public share URL so you can drop a conversation straight into a Slack thread or a customer email.
- Instrumented end-to-end. The demo is itself a Greenflash user. Conversations, events, and analyses flow through the same APIs your product would.
Greenflash, on Your Phone
Triage from a thumb.The full in-app experience is now responsive on any device. Inbox, Overview, product pages, conversation detail, segments, reports, ect. all reflow cleanly for mobile, so the moment you get the Slack alert you can act on it from wherever you are.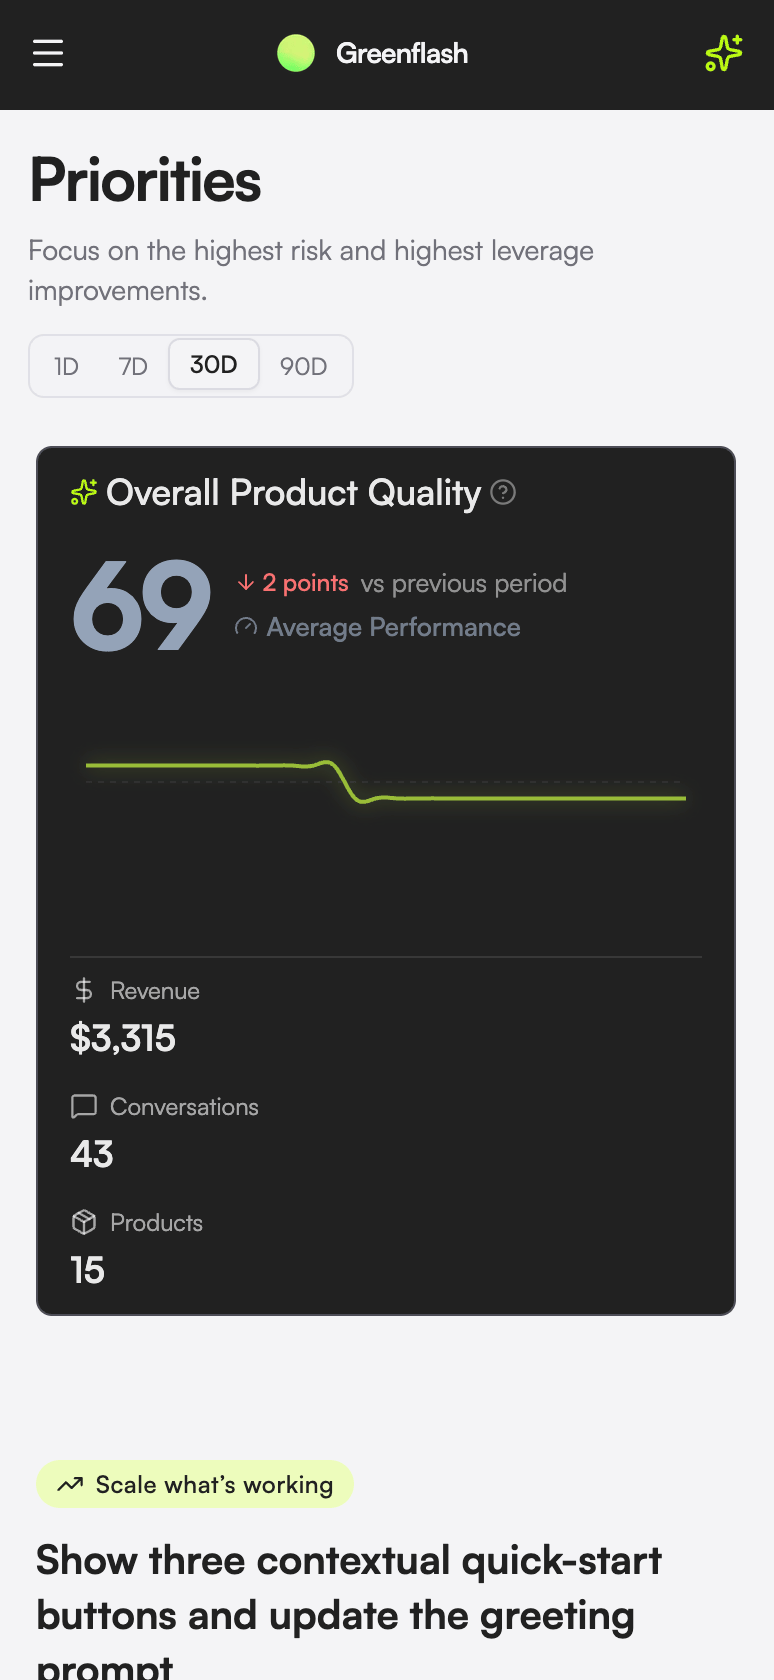
- Mobile-first triage. The Inbox redesign was built around 390px first. Cards collapse cleanly, badges stay readable, and the top recommended action stays visible without scrolling.
- Tables that don’t lie down. Conversation lists, segments, and analyses use mobile-aware layouts instead of horizontally-scrolling tables nobody reads.
- Touch-sized controls. Filters, sheets, and action menus respect tap-target minimums so you’re not fighting the UI on a small screen.
Your Analytics Stack, Now Ours Too
Send events from where you already track them.Greenflash now accepts events directly from PostHog, Amplitude, and Segment. Forward your existing event stream to a per-product Greenflash URL and we’ll automatically resolve users, organizations, and conversations on the way in. No new instrumentation, no parallel tracking layer.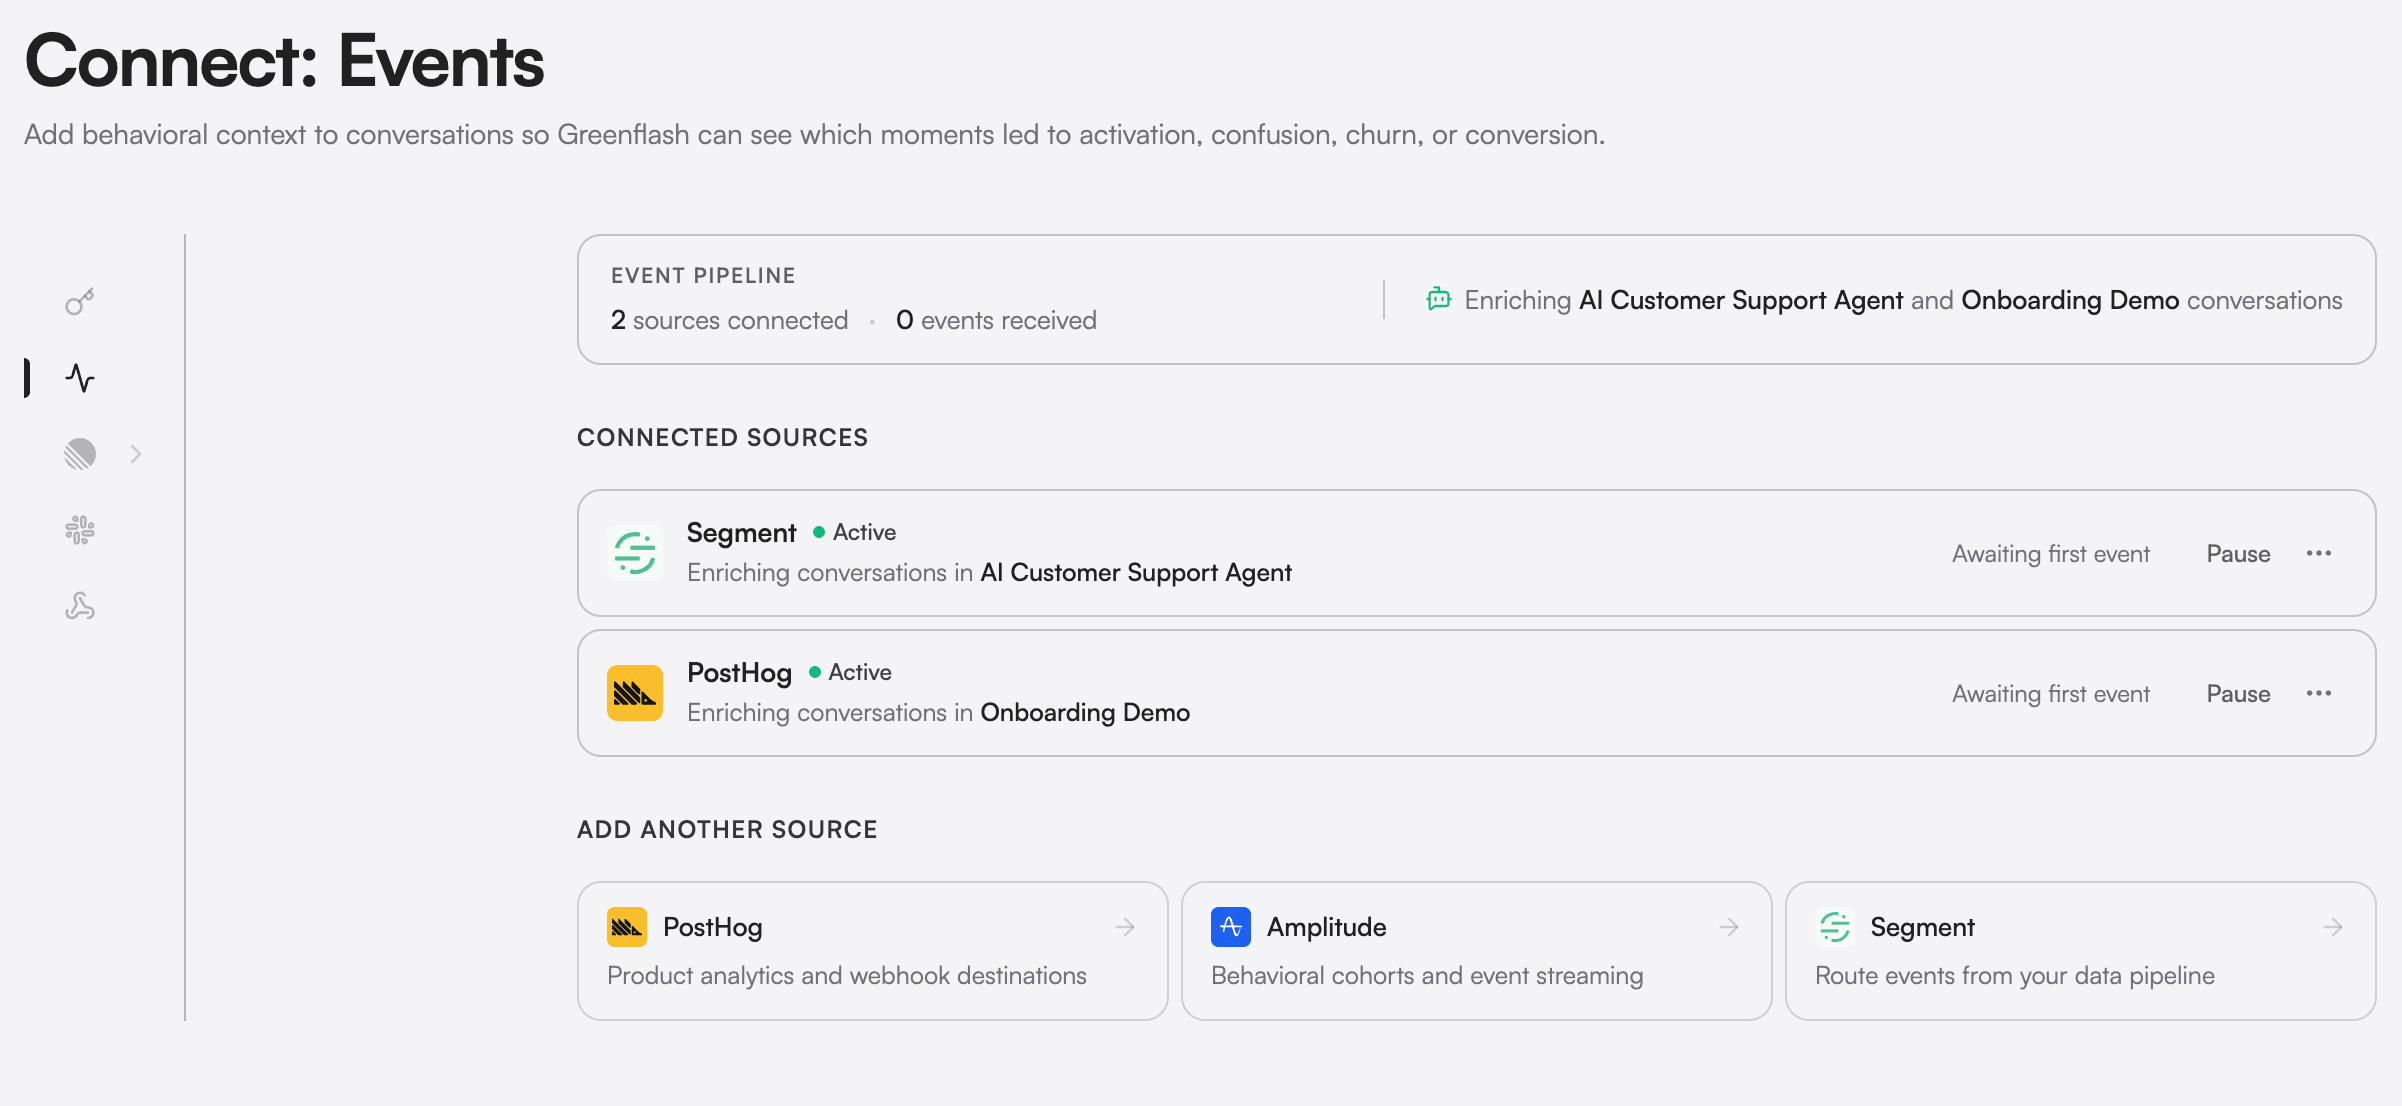
- One-paste setup. Connect from Settings → Connect → Analytics Integrations, copy the secret URL, and paste it into a destination/webhook in PostHog, Amplitude, or Segment. Done.
- Identity resolution included. Incoming events run through Greenflash’s user and organization resolver so events from your analytics stack tie back to the right person and the right conversation automatically.
- Conversation linkage. Where the event payload includes hints (recent conversation IDs, session IDs, user IDs), we link the business event to the conversation that preceded it — closing the same loop the Events API closes, without writing any code.
- Magic-property mapping. Common property names (revenue, plan, currency, conversion type) map to Greenflash’s event schema automatically, so the events you already send become Greenflash-native on arrival.
A New Front Door
A site that tells the full story of Greenflash.We shipped a full redesign of greenflash.ai and refreshed the docs to match. New brand, new typography, sharper messaging, and a faster site under the hood.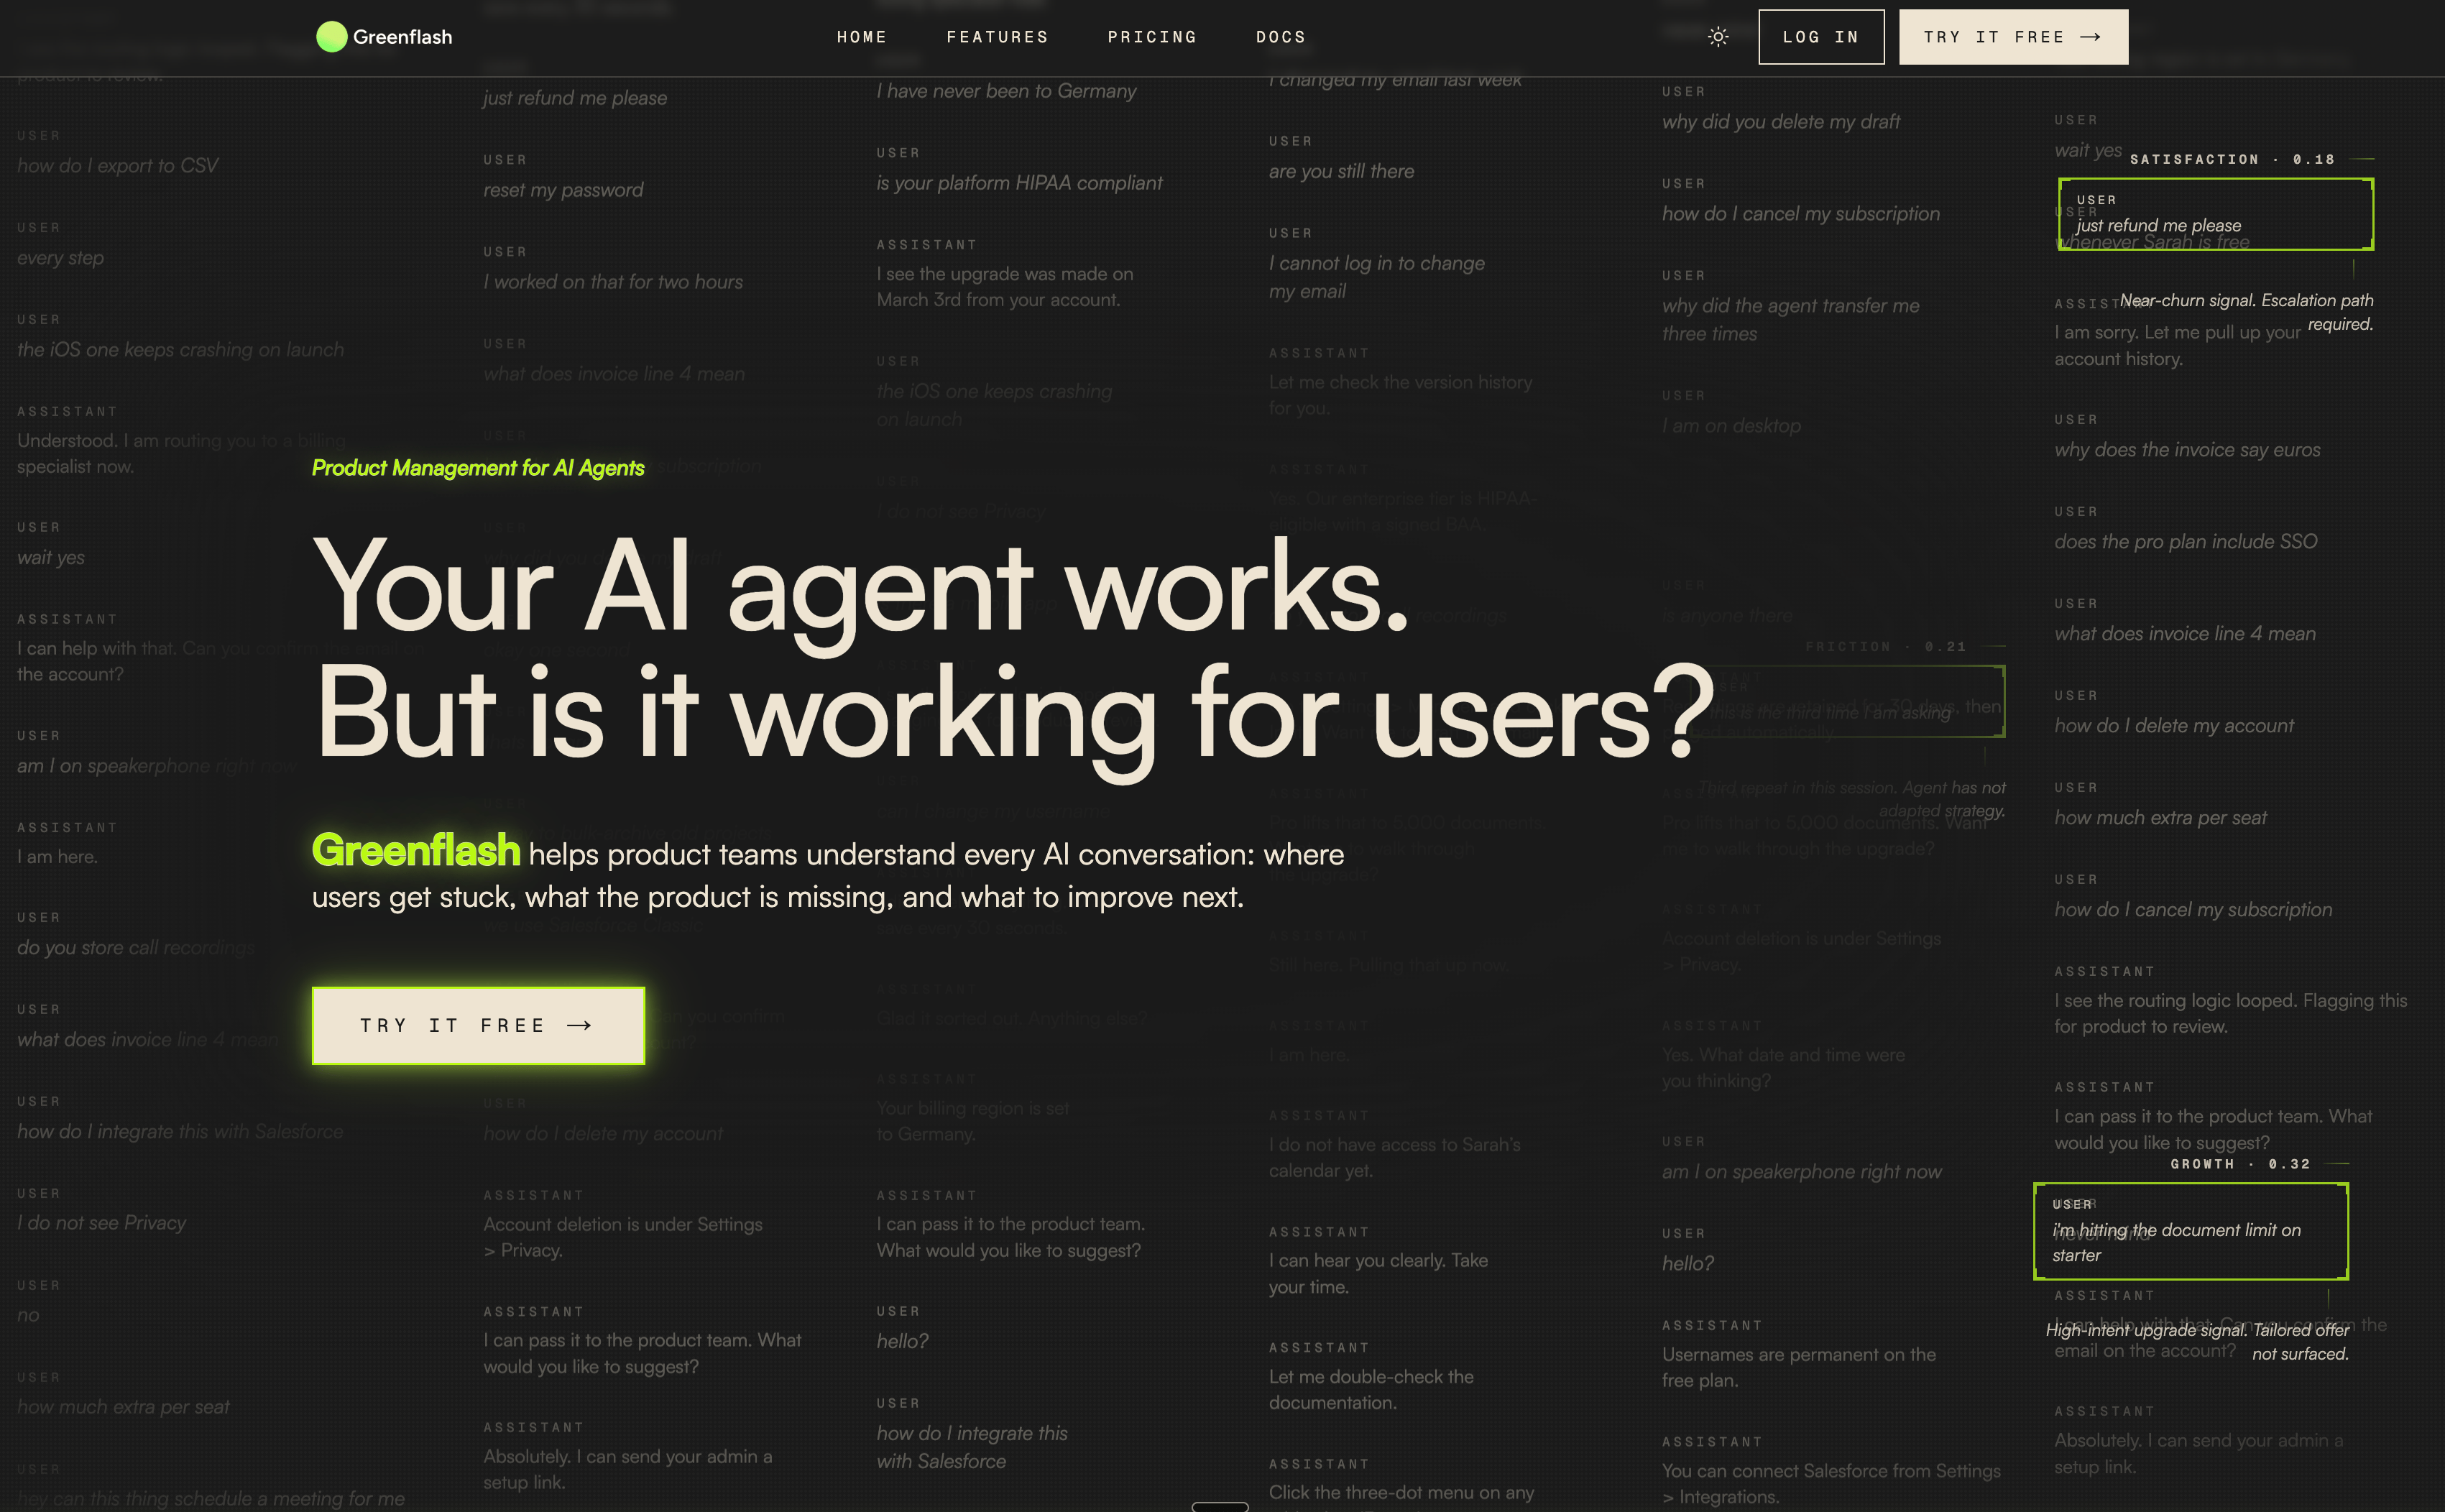
- Clearer story. Restructured top-of-funnel messaging around what Greenflash actually does for AI teams: see what your users are saying, find what’s broken, and act on it. Fewer claims, more specifics.
- Refreshed docs. docs.greenflash.ai got a matching visual pass with cleaner hierarchy and a more readable type scale.
- Faster page loads. Lighthouse scores in prod are now in the green across the board. The site is lighter, ships fewer fonts, and renders quickly even on slow connections.
One Account, Many Workspaces
Switch orgs without switching logins.Greenflash now supports multi-organization membership. You can belong to multiple Greenflash organizations from a single account, switch between them in one click, and invite teammates by email — or let them join automatically via a verified email domain.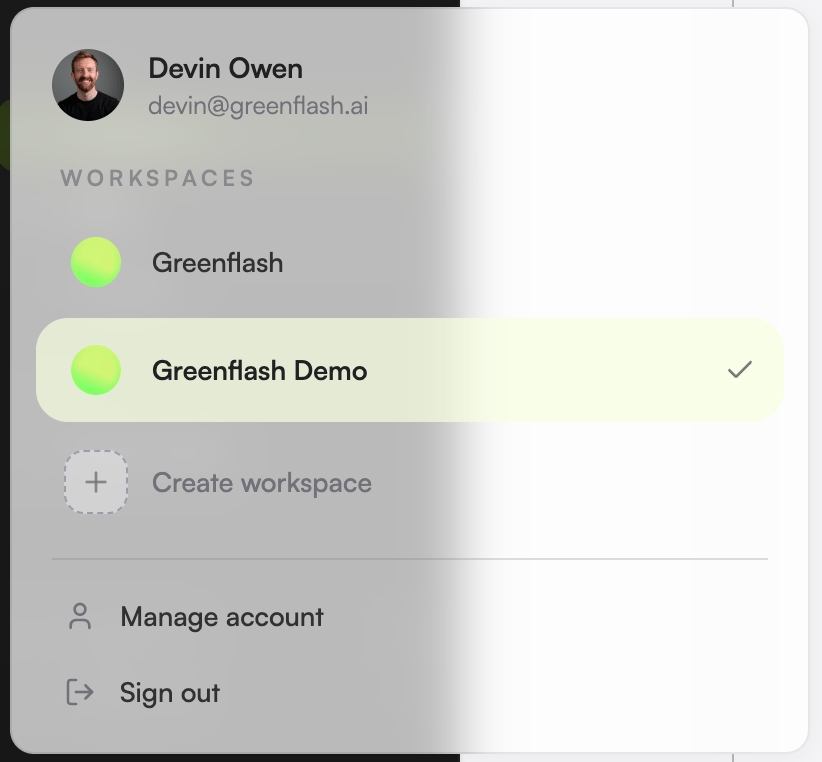
- Per-account org switcher. Your sidebar shows every org you belong to. Switching is instant and preserves your current page where it makes sense.
- Domain-based auto-join. Add a verified email domain in Settings → Organization → Domains and any new signup from that domain joins your org automatically. Stop chasing invite links.
- Join requests + approvals. For domains you haven’t auto-approved, signups land as pending requests you can accept or deny from the new Requests tab.
- Cleaner invitation flow. Invitations, role assignment, and the new “leave organization” flow all live together under Settings → Organization, with proper handling for the orphan-rescue case (your last org, your only seat, etc.).
- Per-org roles. Roles and permissions are now scoped per organization, so the same user can be an admin in one workspace and a viewer in another.
Inbox Triggers, Reorganized
Every flag now has a reason, a group, and a job.We rebuilt the inbox trigger taxonomy from the ground up. Every flag now slots into one of three axes — Attention (something to fix), Opportunity (something to lean into), or Manual (something your team flagged) — and a clear group under that axis (user struggle, revenue risk, quality issue, expansion signal, novel use case, team review). The result: less noise, more obvious priority, and a real signal when a positive opportunity comes through.Highlights:- Opportunity flags, not just problems. New triggers like Buyer asking about more and Unexpected use case surface high-intent, positive signals — the conversations worth a sales touch or a product investigation, not a fire drill.
- Sharper attention triggers. Renamed and re-scoped: Frustrated buyer, Right answer, wrong experience, Hallucination the user accepted, Agent ignored a prompt instruction, Tool failed, user got frustrated. Each one tells you what happened and what to do about it.
- Voice-native triggers. Rage hangup, High response latency, Hard-to-transcribe audio, and Excessive interruptions fire on voice conversations and route into the same inbox.
- Pathology detectors. Clarification loops, Agent monologue, and Re-asked for info catch conversational shapes that quality scores miss.
- Prompt regression detectors. When CQI, friction, or frustration regress after a prompt revision, you get a flag explicitly tied to the prior version so you know exactly what changed.
- Clustered flags. Related flags now group into clusters so a single root cause shows up as one card instead of forty.
Voice Analytics, Transcript-Only
Most voice tools want your recordings. We don’t.Voice agents got the Greenflash treatment. Latency, interruptions, silences, call-end classification, and prosody on every voice conversation, with a synced audio timeline on the conversation detail page. The thing that makes us different: we never see, store, or process the audio file. Greenflash analyzes the transcript and the per-turn timing; the audio streams from your storage to your browser without ever touching us.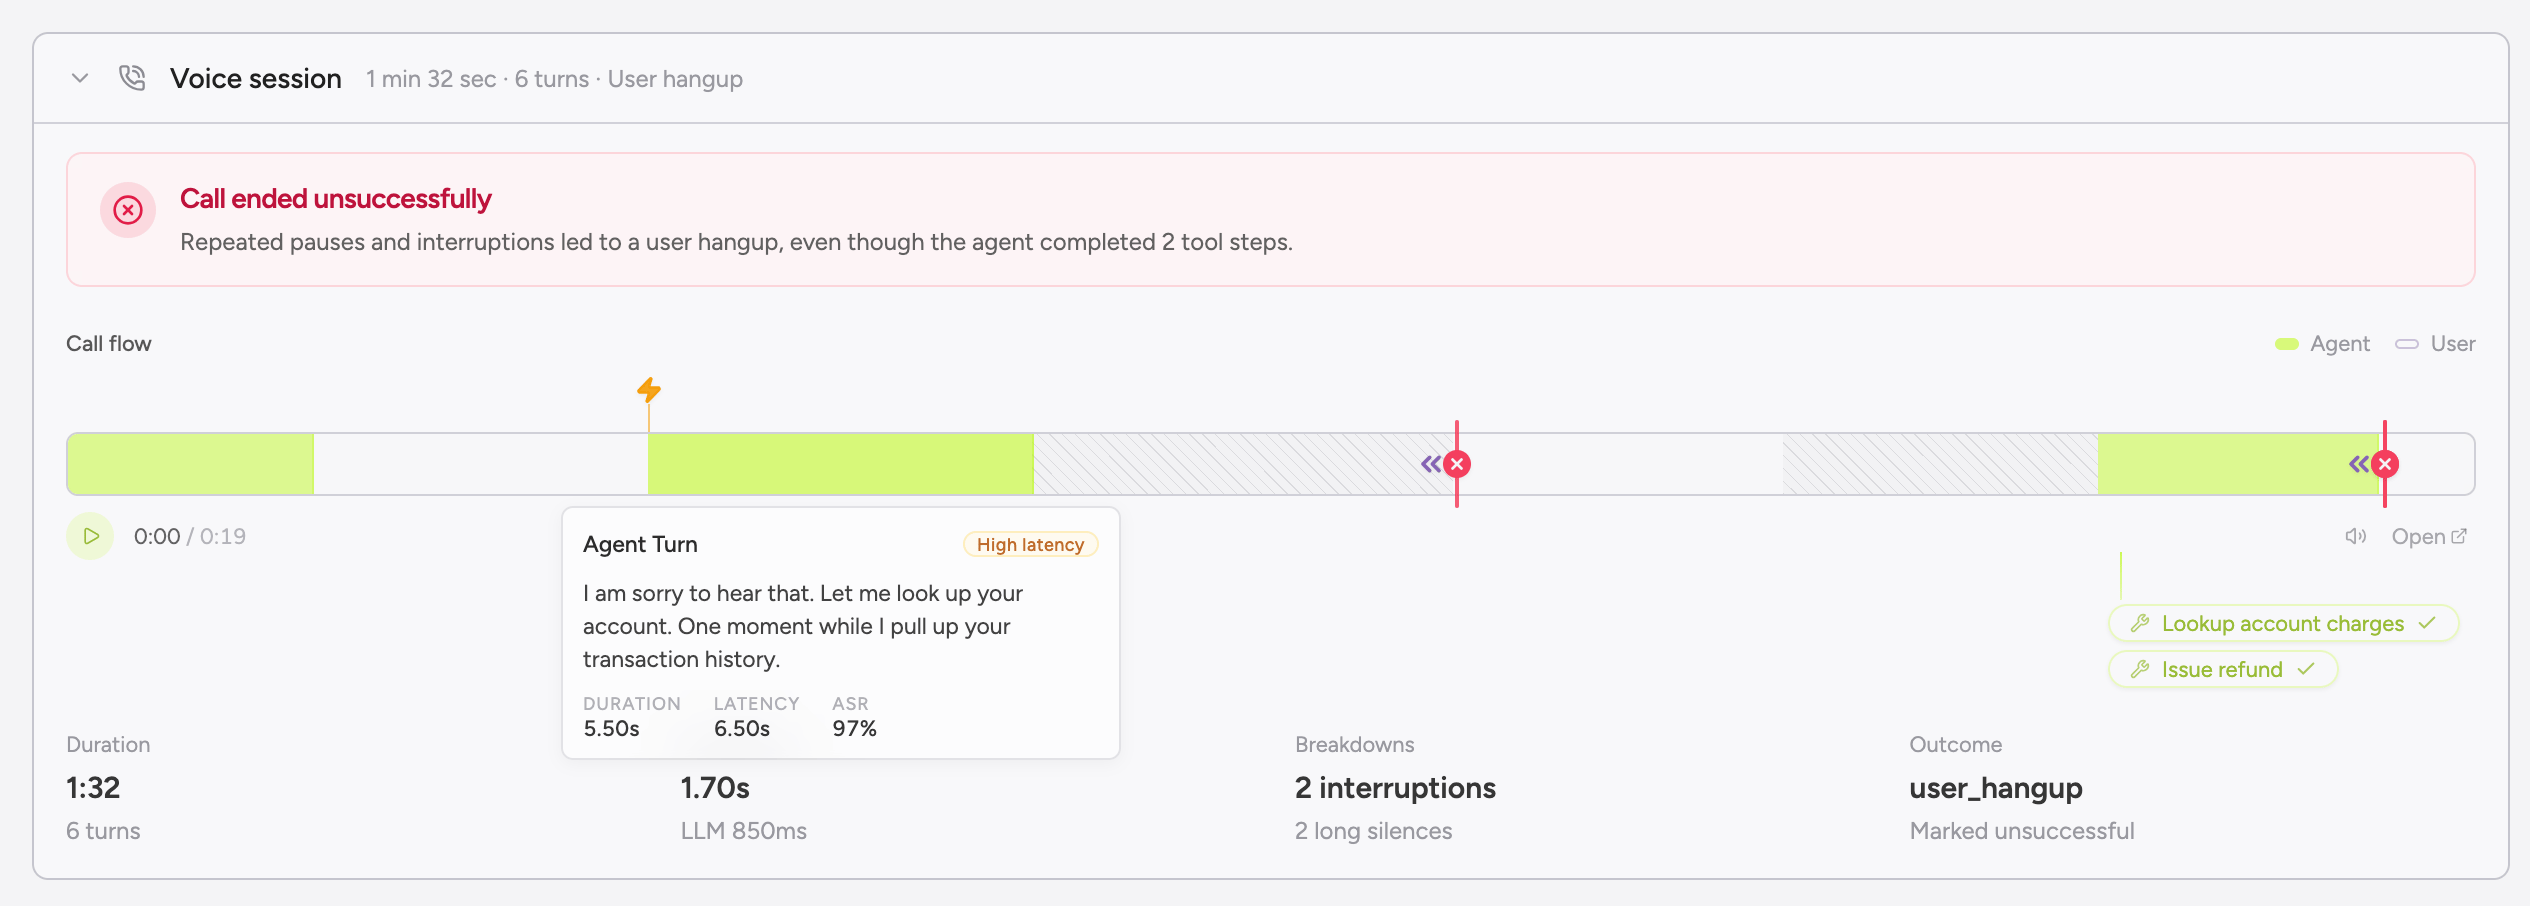
- Auto-detection on any transcript. Voice analytics fires on any conversation with voice-shaped data. Already-instrumented conversations pick up the analyzers retroactively, no backfill required.
- Five voice analyzers. Latency (TTFA, ASR, LLM, TTS), Interruptions, Silences, Call-end (completed, abandoned, escalated, failed), and Prosody (sentiment, arousal, emotion). Deterministic by design so week-over-week comparisons stay honest.
- Synced audio + interactive timeline. When your provider supplies a recording URL, the player scrubs in lockstep with the per-turn transcript. Click any turn to jump the audio and scroll the conversation.
- Drop-in webhook integrations. Vapi, Retell, ElevenLabs, Bland, Synthflow, and Simple.ai all work by pasting a Greenflash URL into your provider’s webhook config. Custom voice infra (LiveKit, Pipecat, OpenAI Realtime, in-house) just sends transcripts.
- Conversation pathologies. Three new cross-channel detectors (clarification loops, repeated information, agent monologue) fire on voice and text alike. They show up everywhere, but voice transcripts make the conversational shape painfully obvious.
- Prompt regression detection. Voice metrics feed Greenflash’s regression engine. A latency p95 jump after a prompt deploy surfaces in Recent Regressions on the product page within 30 conversations.
The Inbox Got a Promotion
Threaded comments on every message, and a list that tells you what to do next.Your inbox is where flagged conversations land for your team to review. Two big upgrades shipped: every conversation (and every individual message inside it) now has a threaded comment surface, and the inbox list itself surfaces the most-recommended next action on each item without you having to open anything.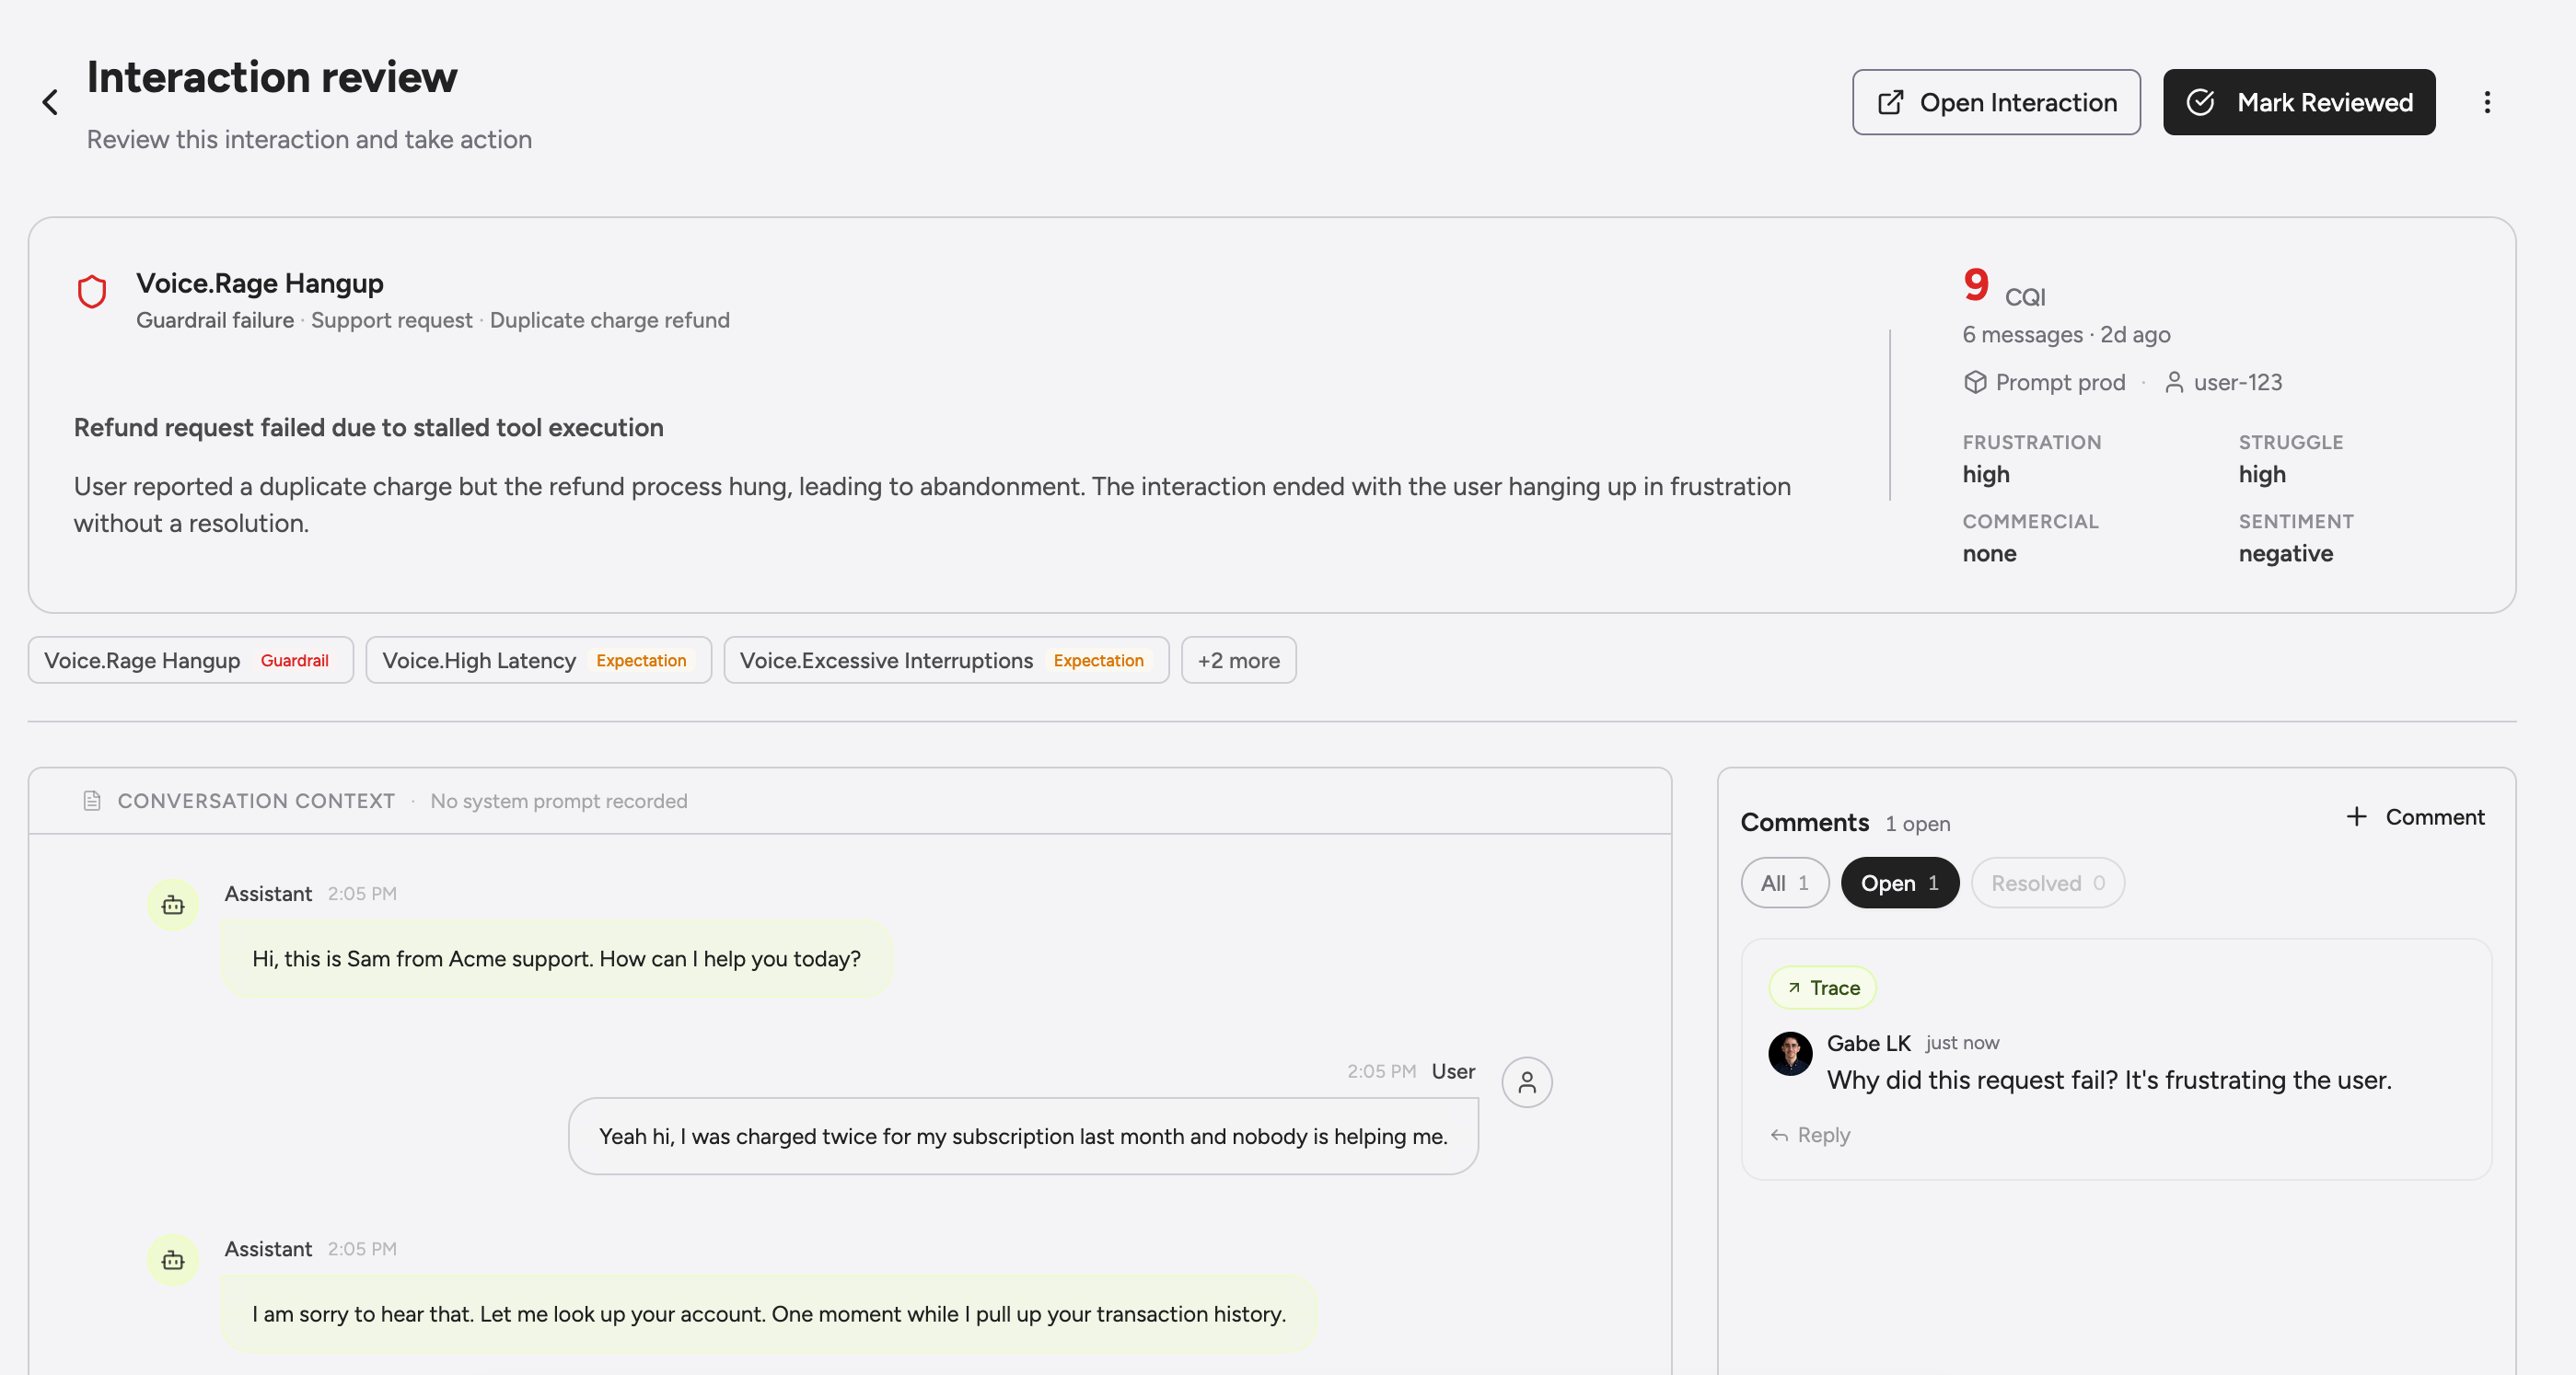
- Message-level comments. Leave a note on a specific message or on the conversation as a whole, and your team sees it inline. Useful for review notes, training, and pulling specific exchanges into Linear (comments sync both ways).
- Top recommended action in the list. The inbox tells you the highest-priority next step for each flag right in the row. Triage from the list instead of clicking each item to find out.
- External ticket status alongside flags. If you’ve pushed a flag to Linear, the inbox shows the linked issue and its current state next to the conversation. Switching tools to check status is no longer required.
- Faster list rendering. Denormalized inbox storage means the list loads instantly even at thousands of flags.
Greenflash, Meet Linear
File the conversation you’re reading. From wherever you’re reading it.We shipped our first ticketing integration. Push a flagged conversation, a custom analysis violation, or a product-page recommendation directly into Linear without copying context across tabs. State and comments sync both ways automatically, so once an issue is filed Greenflash and Linear stay current on their own.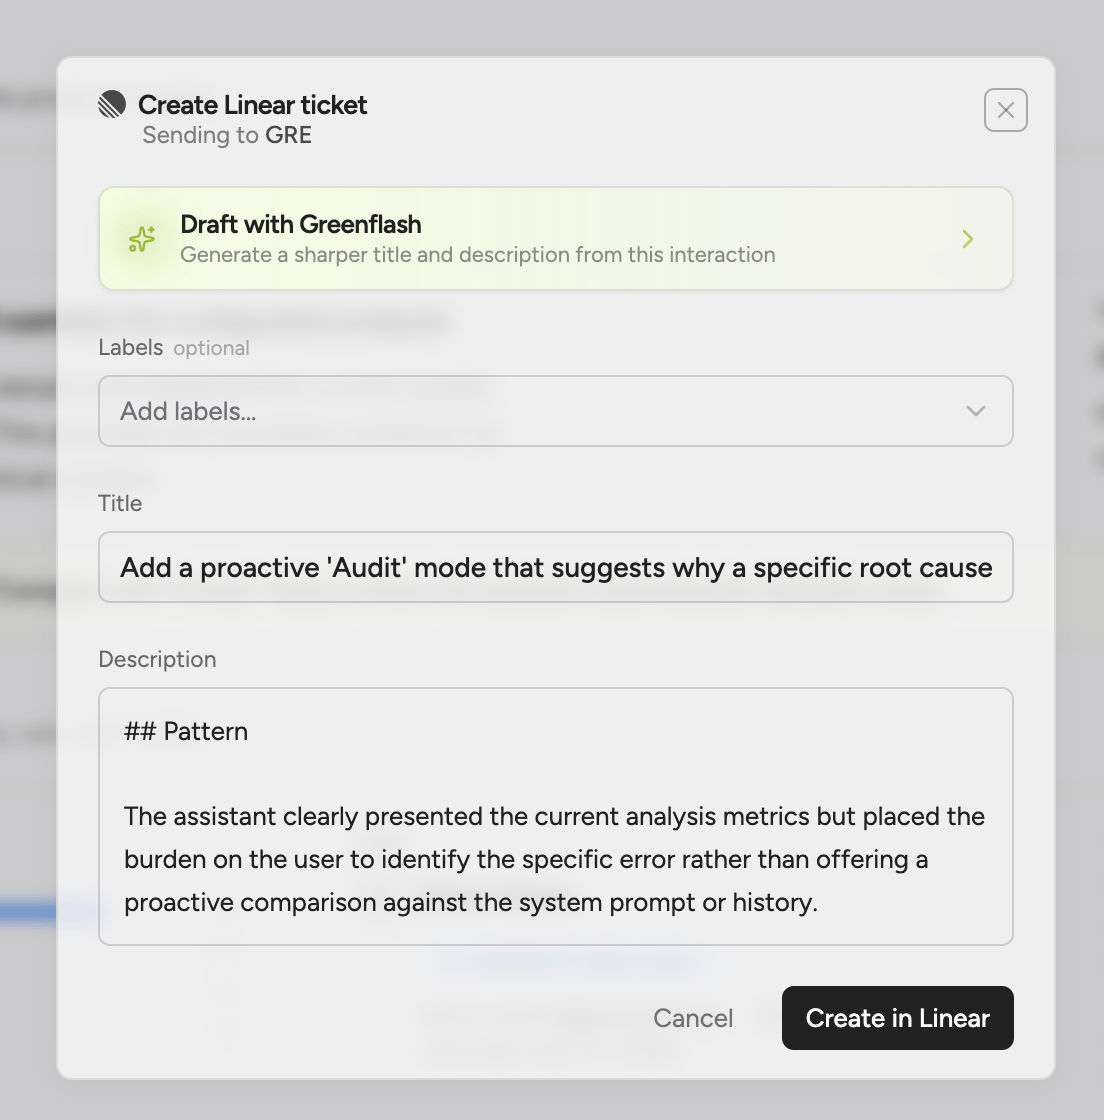
- Push from anywhere. The inbox, the review queue, the conversation detail page, the product-page recommendations card, the
cmd-kcommand palette, and the Greenflash agent itself can all create Linear issues. We put the button everywhere we found ourselves wanting to file something. - OAuth install. Connect Linear from Settings → Integrations and pick a default team. The connection is encrypted at rest and scoped to your tenant.
- Bidirectional state sync. Close, reopen, or delete an issue in Linear and Greenflash mirrors the change. Close a flag in Greenflash and Linear updates the linked issue.
- Bidirectional comments. Comments on the Linear issue appear on the Greenflash conversation, and vice versa, with original author attribution preserved. PMs working in Linear and reviewers working in Greenflash can hold the same thread without either side switching tools.
- Suggestion taxonomy. Greenflash classifies each ticket (
bug,prompt-fix,model-switch,safety,capability-gap) and the classification carries over to Linear. Filter your Linear backlog by suggestion type to route bug-class tickets to one team and prompt-fix tickets to another. - Agent-drafted tickets. Ask the Greenflash agent in the web app or in Slack to file a ticket for what you’re looking at, and it returns a preview card with the conversation context already attached for you to review.
Greenflash, Meet Your Terminal
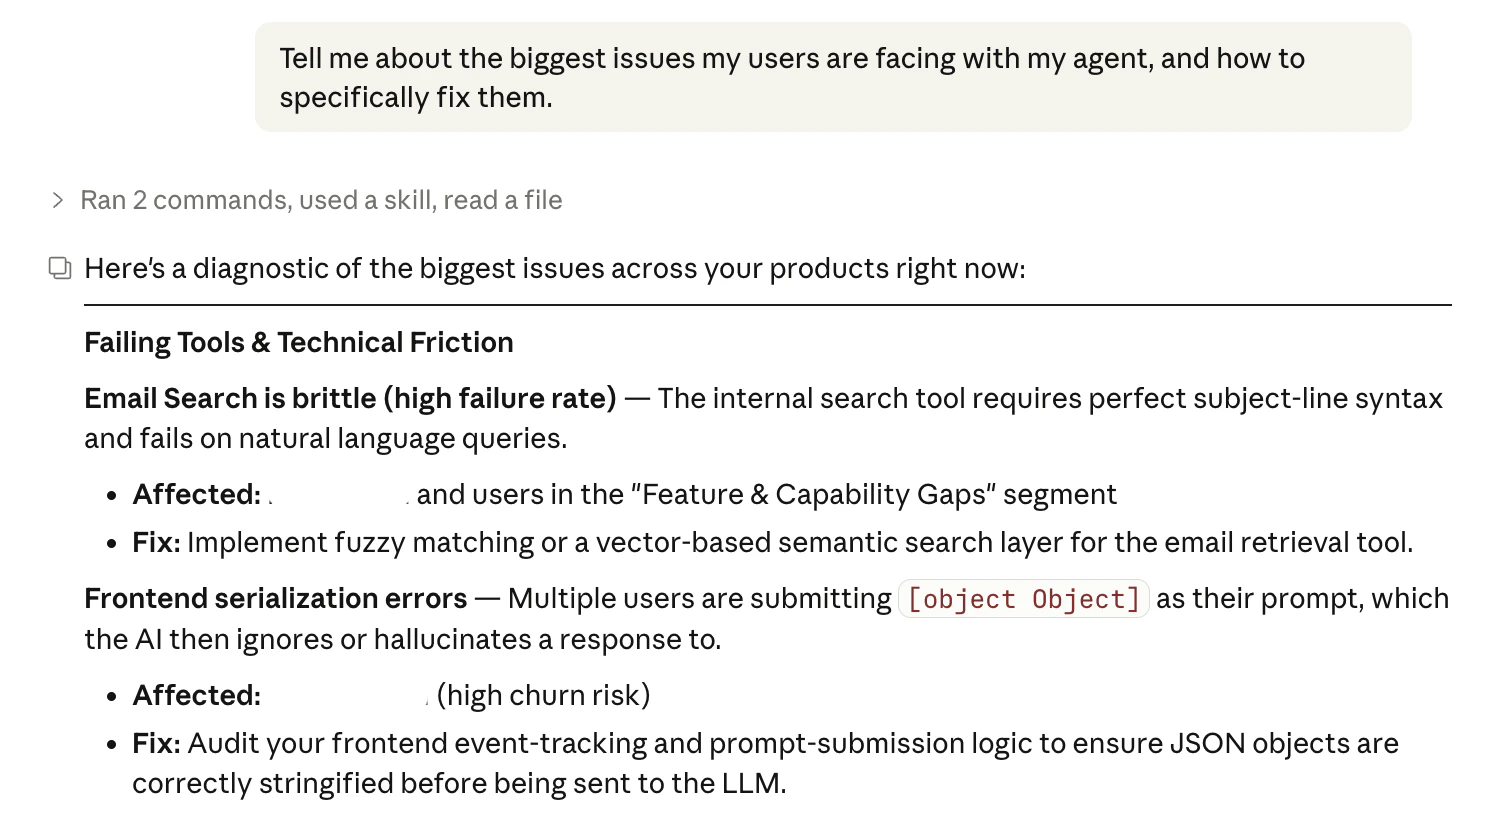
Ask what’s broken. Fix it without leaving your editor.We built a Claude Code skill that brings Greenflash directly into your development workflow. No browser tabs, no context switching. Ask your coding agent what’s broken, who’s struggling, or which prompt needs work — and get answers grounded in real conversation data.This isn’t a dashboard summary piped into your terminal. It’s a full analytical agent that talks to the Greenflash API, runs multi-step investigations, and can implement fixes directly in your codebase.Highlights:-
Conversational diagnostics — Ask “what’s broken?” and get a prioritized list of failing tools, root causes, guardrail violations, and affected users. Then say “fix it” and the agent edits your code directly.
- Prompt and model optimization — Surface quality issues, hallucination rates, and model comparison data from real conversations. The agent finds the prompt file, suggests the edit, and applies it on confirmation.
- Health monitoring — Get a product health overview without leaving your editor. Quality trends, anomalies, safety signals, sentiment shifts — all from a single command.
- User and segment intelligence — Look up specific users, identify who’s churning, and understand segment behavior without switching to the browser.
- Inbox triage — Review flagged conversations prioritized by severity, right in your terminal.
-
Zero-config setup —
npx skills add greenflash-ai/agent-skillsor install from the Claude Code marketplace with/plugin marketplace add greenflash-ai/agent-skillsthen/plugin install greenflash@greenflash-plugins. The skill asks for your API key on first run and saves it to the project. Done.
Reports That Write Themselves
The one your VP actually wants to read.We shipped a full report generation engine. Tell Greenflash what you want to understand — root causes, segment comparisons, quality trends, cross-product patterns — and it builds a comprehensive, data-backed report using Claude. Not a PDF export of your dashboard. A real narrative with evidence, recommendations, and charts.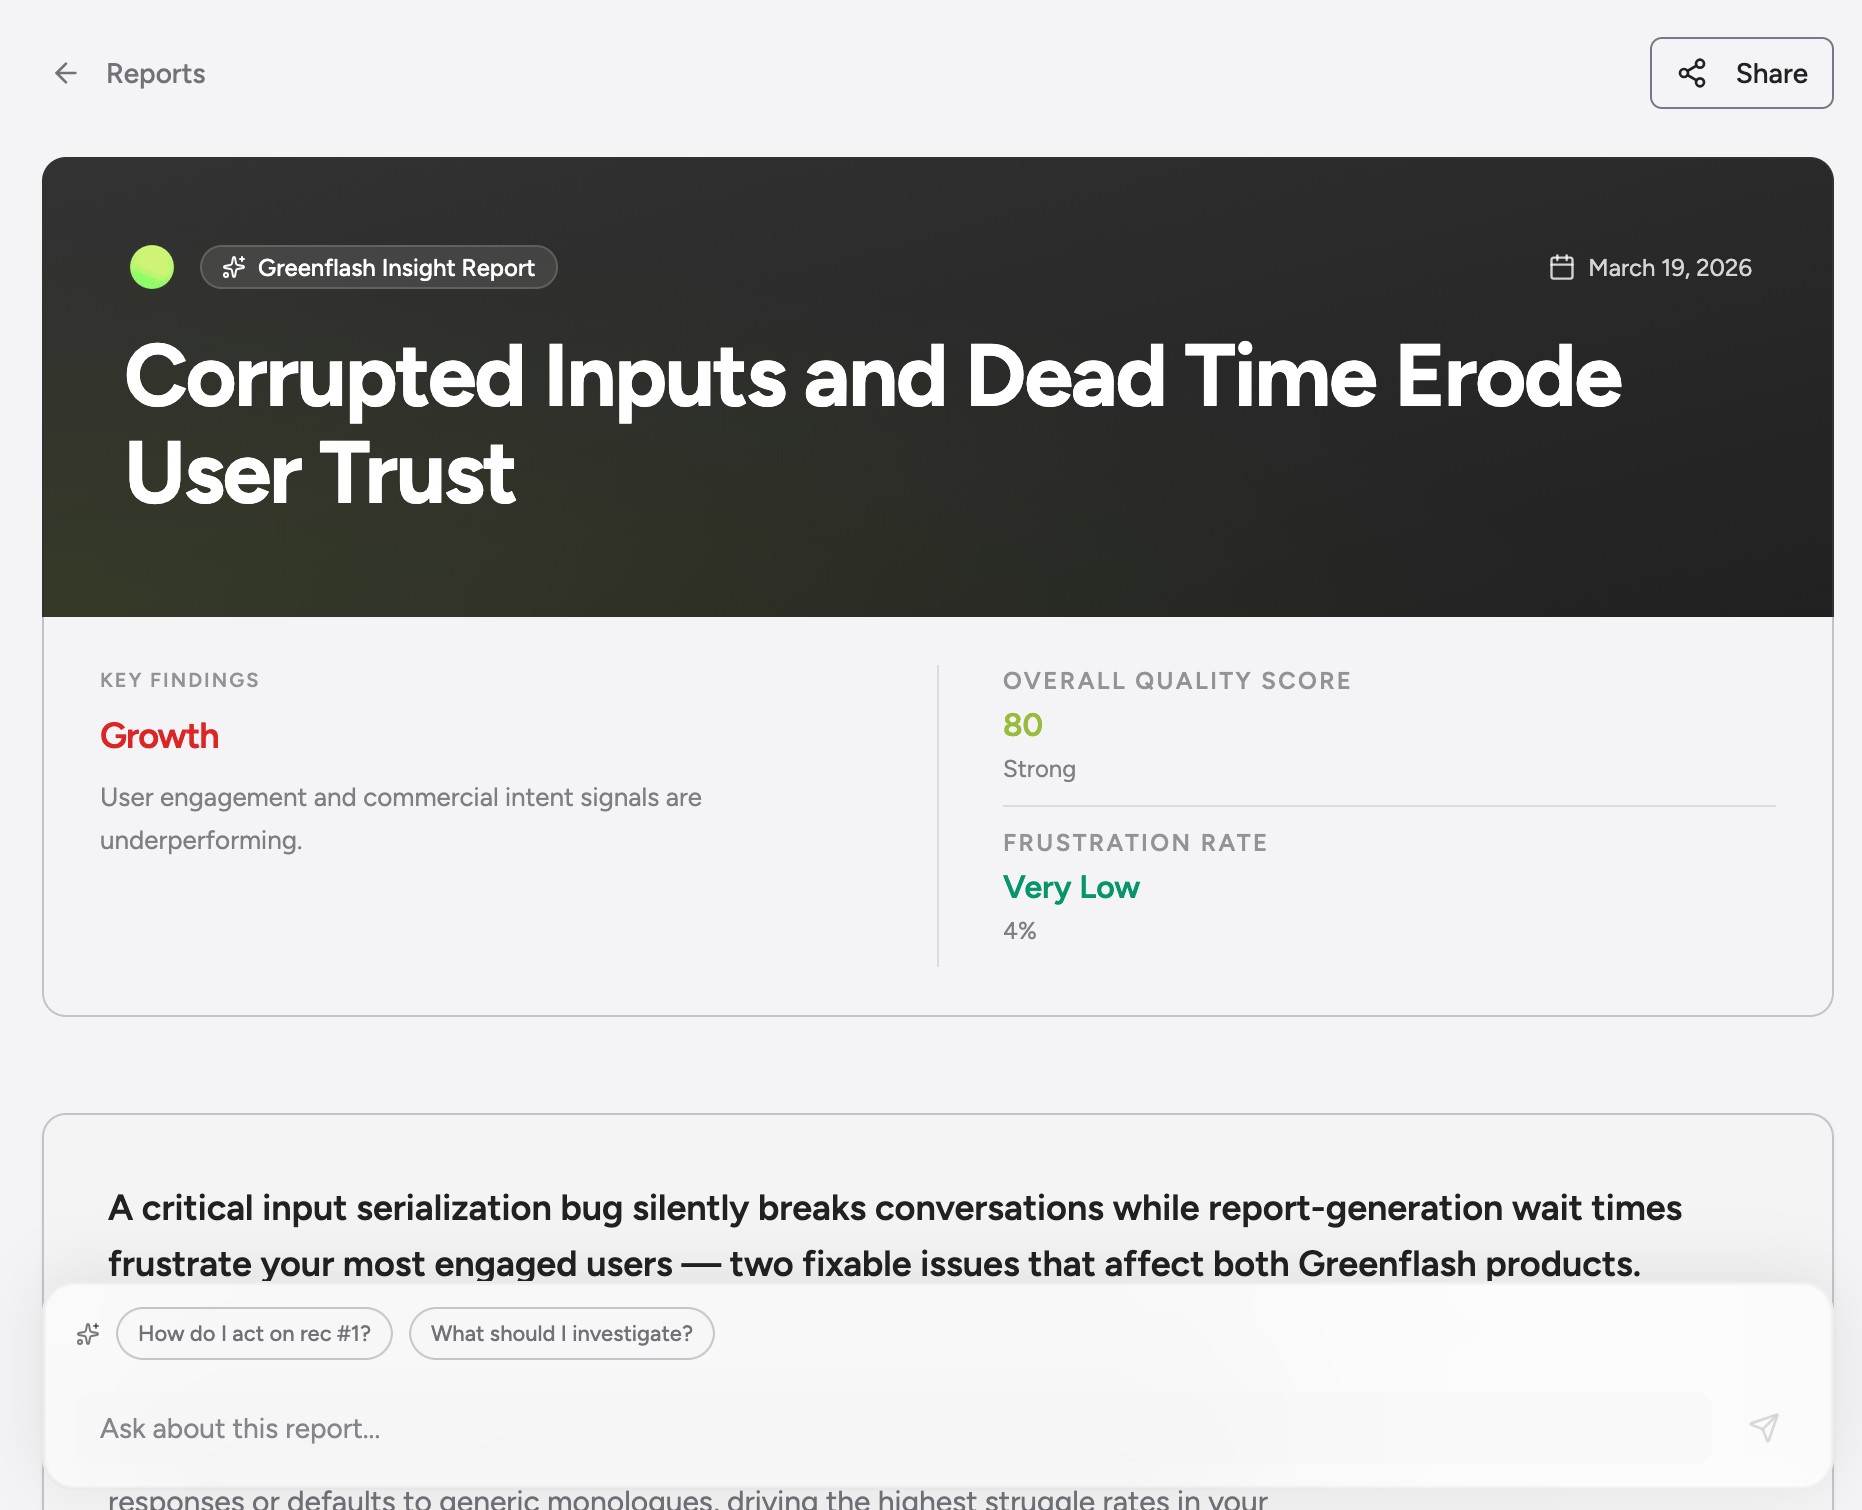
- AI-composed narrative — Reports are generated using your actual conversation data, quality scores, topic analyses, and business events. Headlines, executive summaries, key findings, and prioritized recommendations — all structured and evidence-backed.
- Inline evidence — Every claim links back to real conversation excerpts. No hand-waving, no vibes. Your stakeholders can click through to the sources.
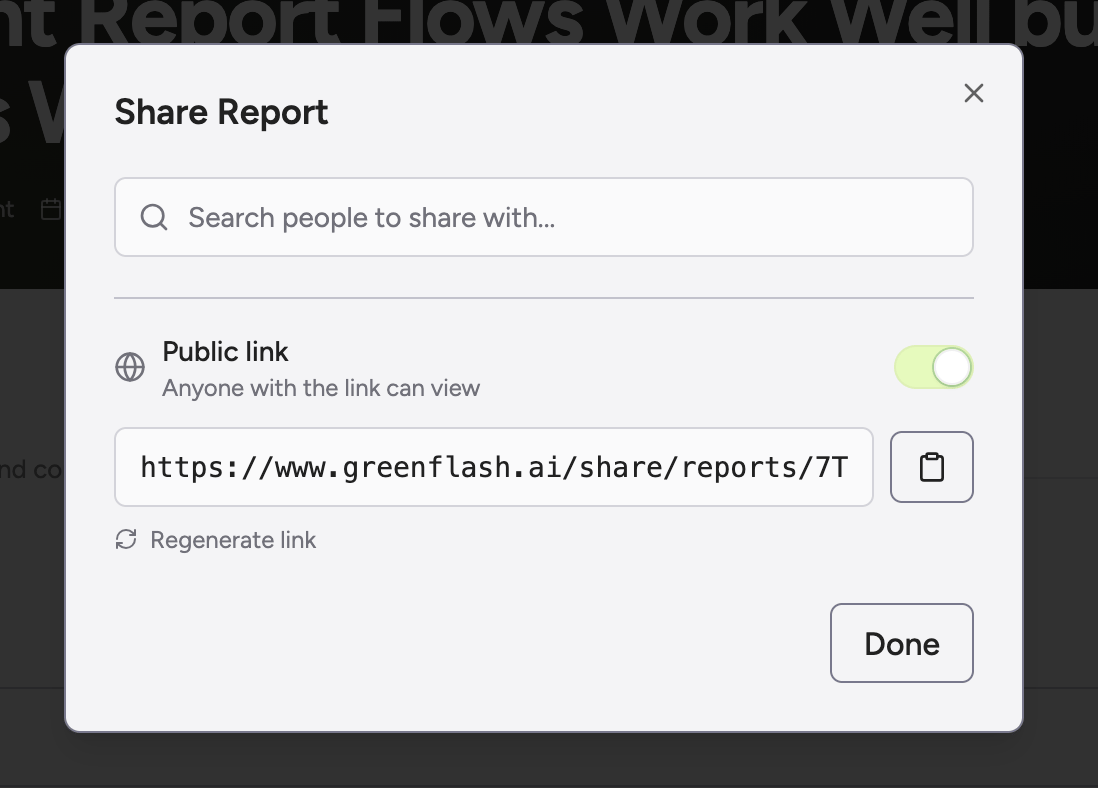
-
Shareable — Share with specific team members or generate a public link for anyone. Reports render beautifully without authentication.
- Chat-driven refinement — Don’t like what the report focused on? Chat with it. Ask it to dig deeper into a specific area, add a section, or regenerate with different emphasis.
- Realtime generation — Watch the report build in real time as Greenflash gathers data, analyzes patterns, and composes sections. Progress updates keep you in the loop.
- Covers the full picture — Pillar breakdowns (Satisfaction, Growth, Friction, Safety), topic analyses, prompt and model recommendations, segment comparisons, temporal anomalies, and cross-product insights. All in one document.
User Research Just Got a Workspace
Cohort-first. The way user research should work.Most “users” pages are flat lists you scroll through hoping a pattern shows up. We rebuilt ours around segments. Seven prebuilt cohorts populate on day one (Churn Risk Users, Product Champions, Biggest Opportunity, Happy Users, Unhappy Users, Safety Concerns, Feature Gaps), a visual builder lets you stack predicates with the count updating live, and every analysis in Greenflash now scopes to any segment you can build. Highlights:
- Three-section workspace. Spotlight (the cohort that needs attention right now), Explore grid (every system segment as a tile with live counts and a sparkline), and Saved cohorts (yours, pinned). Click any segment and the rest of the workspace pivots through that filter. URLs are shareable, so a deep-linked cohort drops cleanly into Slack or a PR comment.
- Seven prebuilt cohorts to start from. Useful out of the box, also a launchpad for the custom segments that actually matter for your business. Most teams use the prebuilt ones to figure out what they want to track, then build their own.
- Visual builder with live counts. Stack predicates on analysis metrics, flags, user properties, conversation properties, conversation count, or last seen. The count updates as you go so you know whether the cohort is workable before you save it.
- Run any analysis on any segment. This is the unlock. Point a custom analysis at a custom segment for cohort-specific guardrails. Pull pillar score breakdowns. Run segment-scoped briefs to Slack. Ask the Greenflash agent questions grounded in just that cohort’s conversations.
- CSV export. Pull a segment with 21 attributes per user (name, email, CQI, pillar scores, last-seen, conversation count, etc.) for outreach, win-backs, or BI imports.
The Control Center
One shortcut to run everything.We built a raycast-style command palette. Not the “jump to a page” kind. The kind where you stop what you’re doing, hit⌘K, and the app meets you halfway.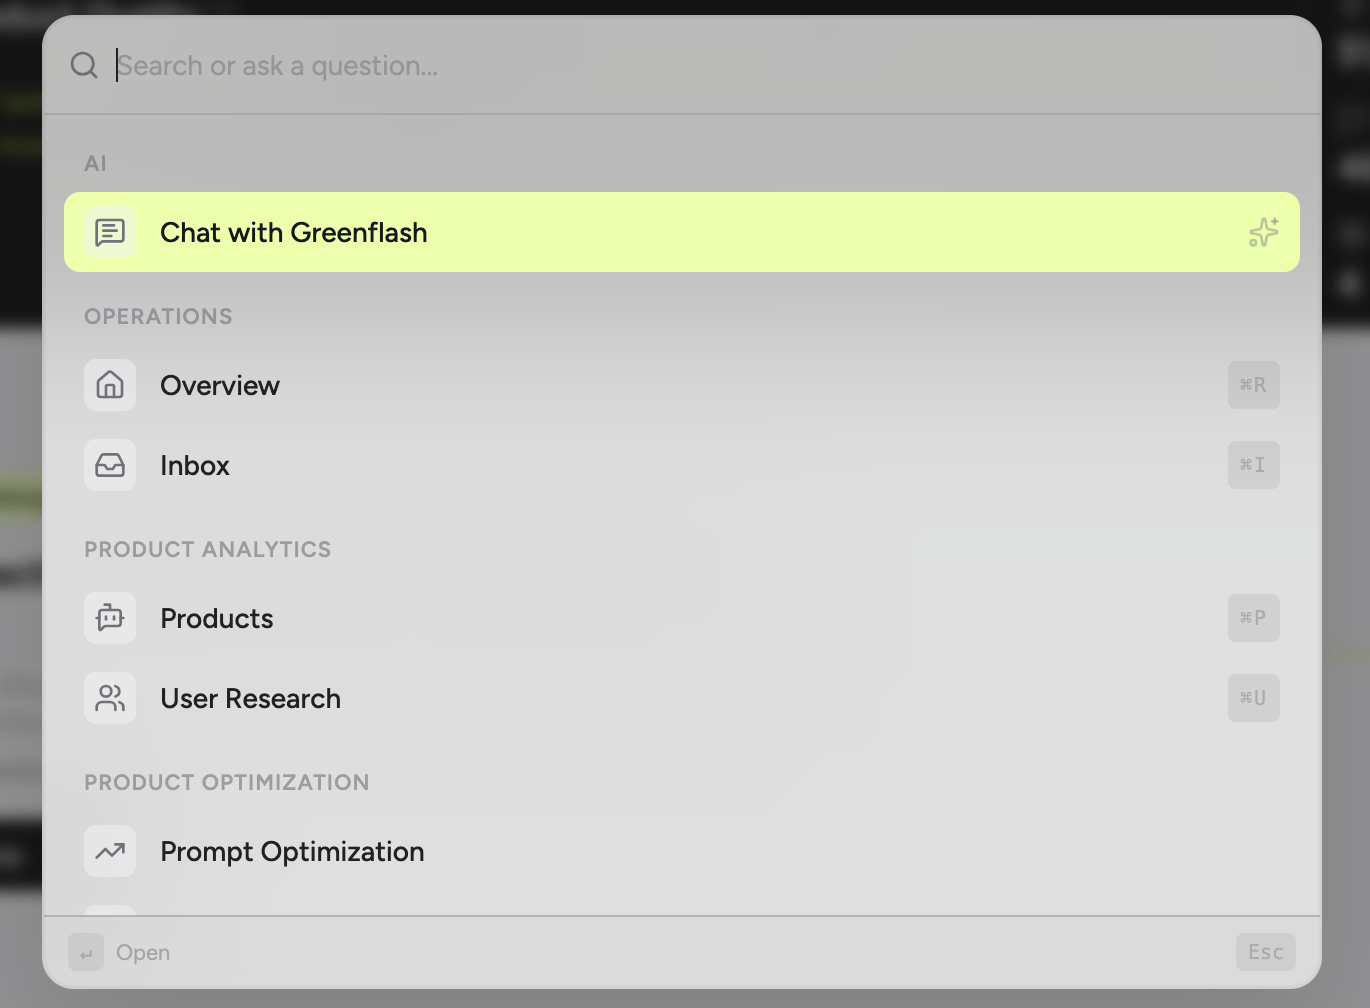
- Universal search — Users, products, organizations, settings, and every major surface in the app. Results are instant and keyboard-navigable.
-
Built-in AI — Ask Greenflash anything about the page you’re on. Summarize it, interrogate it, get action items. The AI panel lives inside the palette, not behind another click.
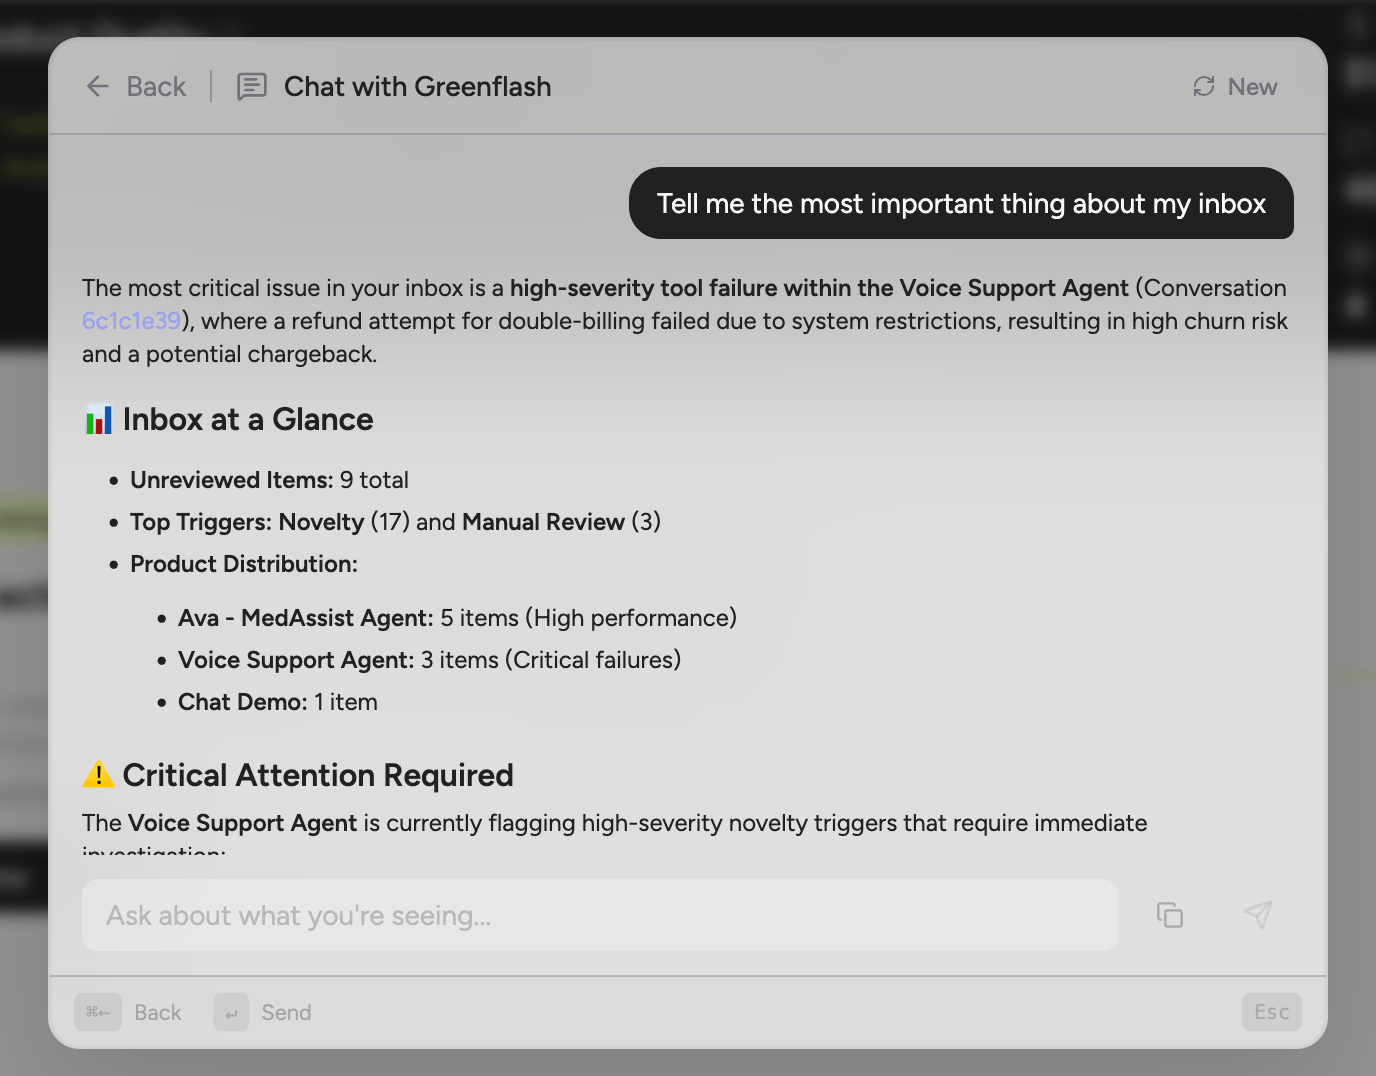
- Contextual actions — The footer tells you exactly what each keystroke does for the selected item. No guessing, no documentation required.
⌘K from anywhere. That’s the whole onboarding.Slack Just Entered the Chat
The conversations that need attention, delivered to Slack.Greenflash analyzes real user conversations and surfaces issues, trends, and optimization opportunities. Now those signals go straight to your team.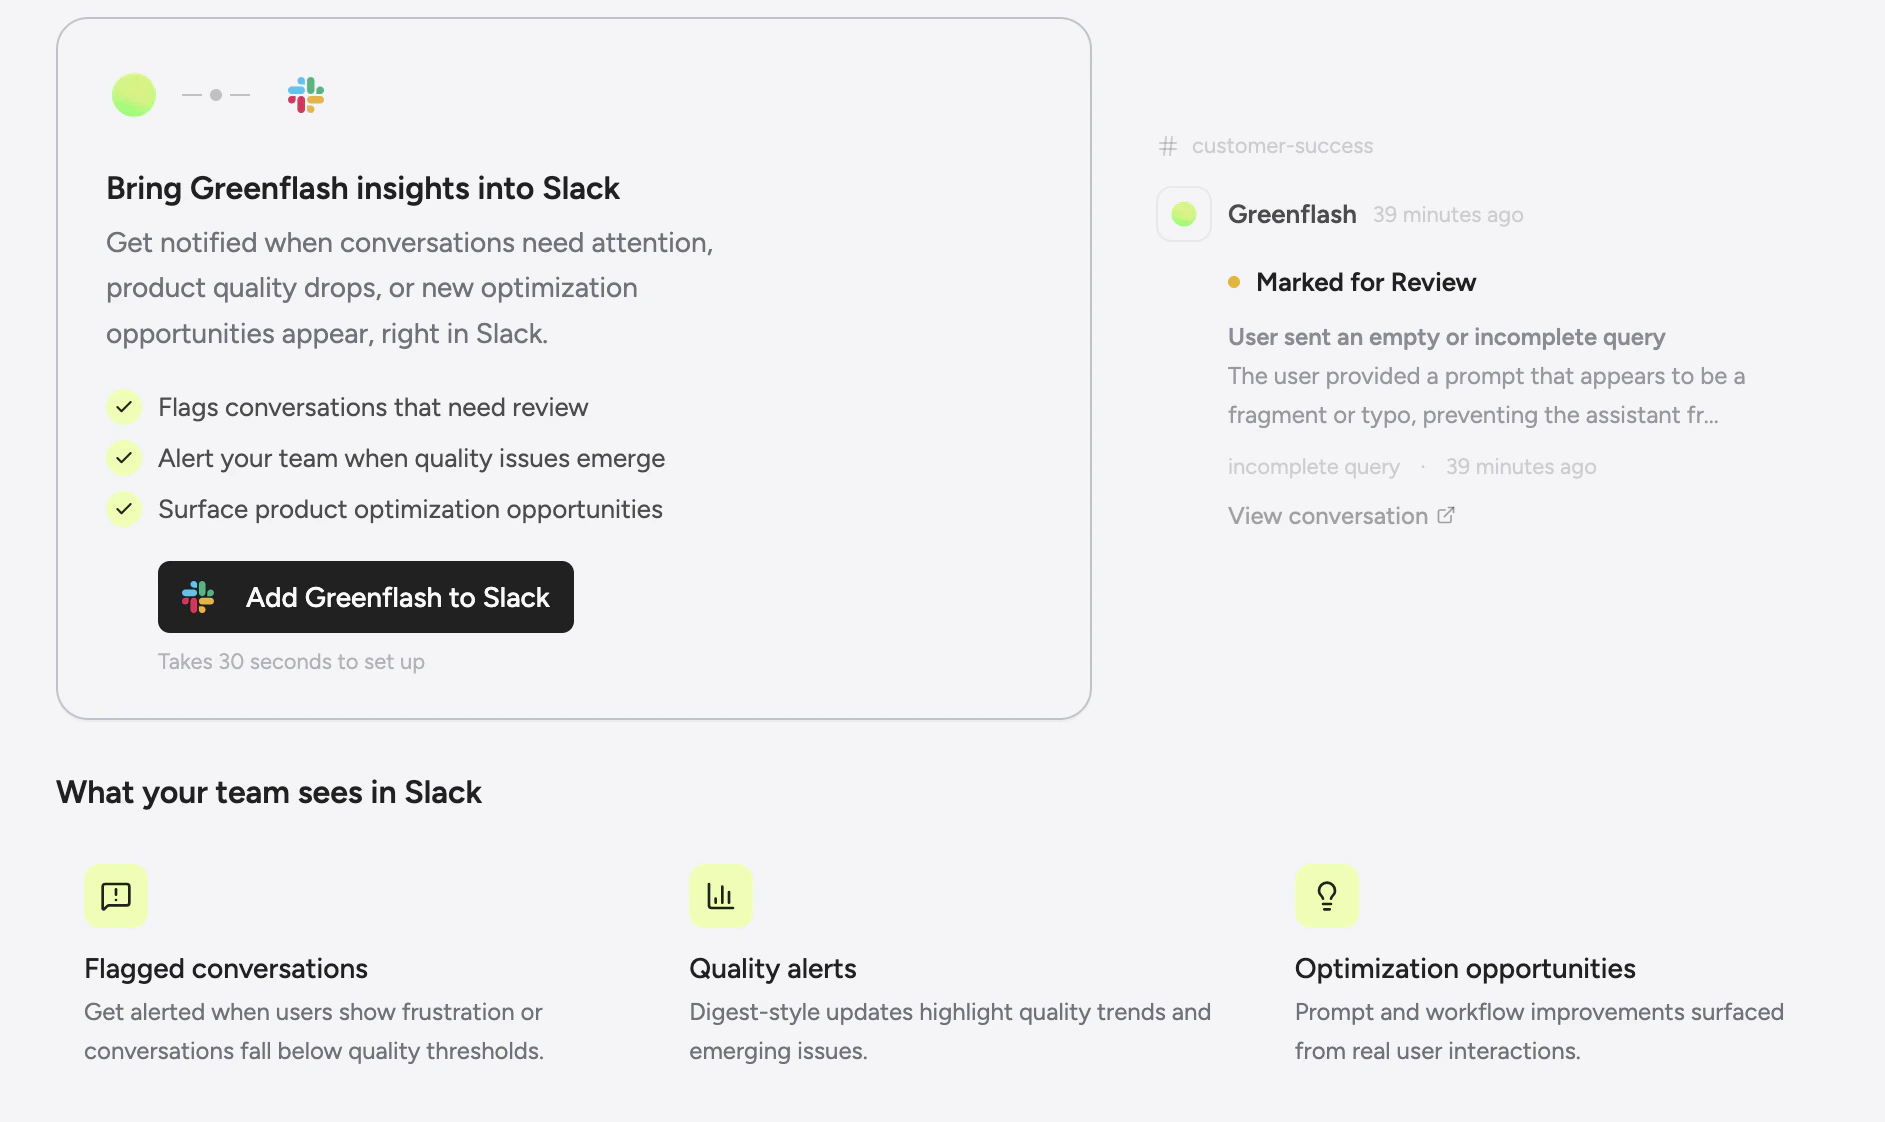
-
Know when customers are struggling Get notified the moment a user hits friction, expresses frustration, or has an experience worth investigating. See the issues before they become patterns.
-
Catch guardrail violations in real time When a custom analysis fires: a safety guardrail trips, an expectation fails, or evidence surfaces; your team sees it in Slack immediately, not after someone logs in to check.
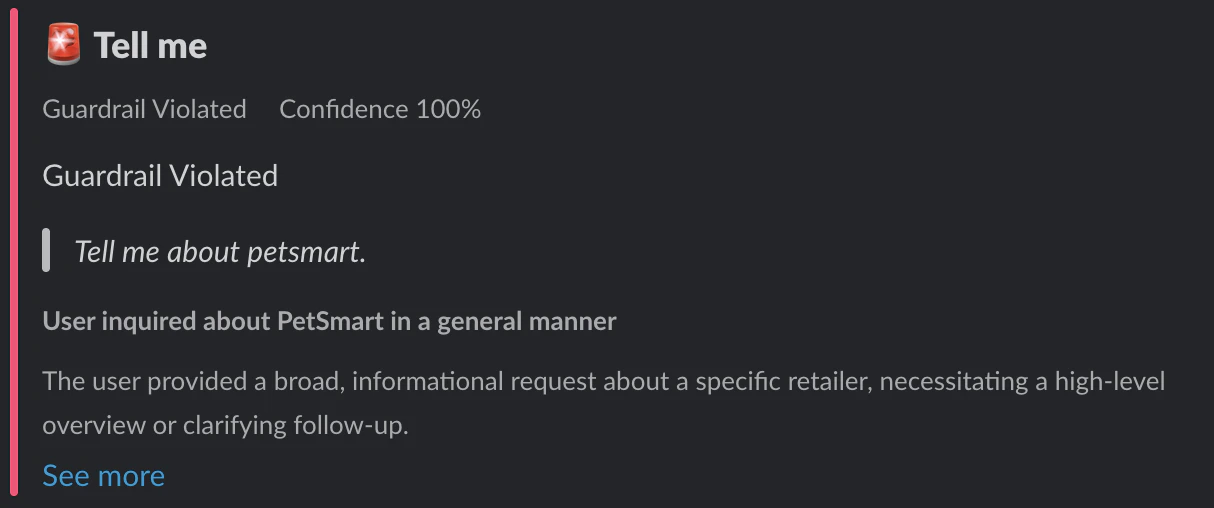
-
Flag conversations for your team When an interaction is flagged for review, the alert lands in the channel where your team already triages issues. No context switching, no missed moments.
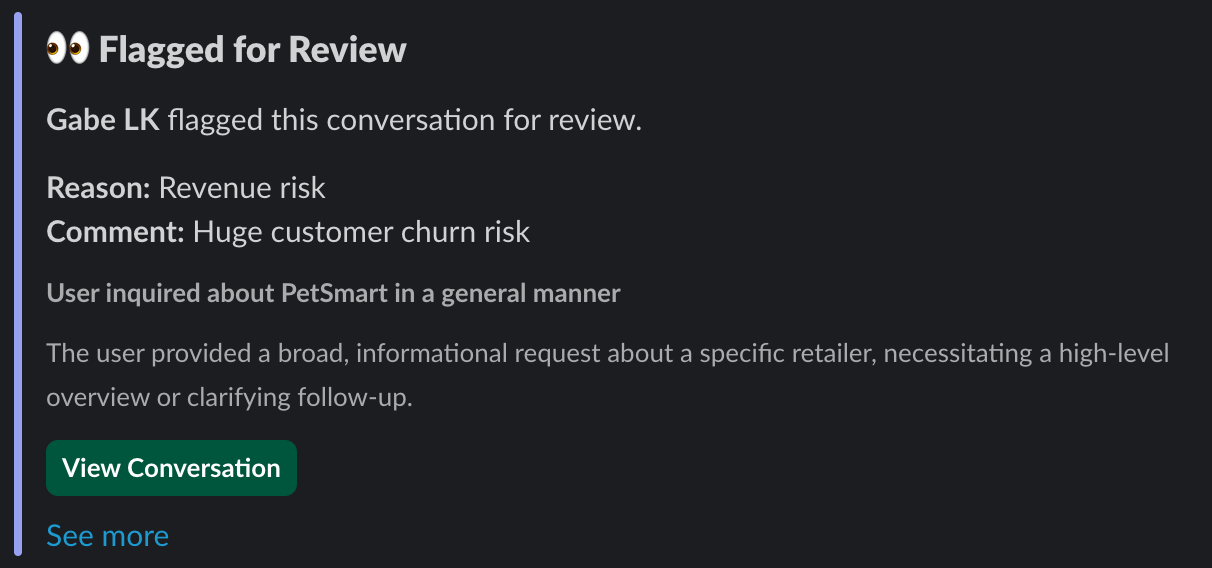
-
Route by what matters Send safety alerts to
#incidents, product quality issues to#product, and review flags to#support. Different events, different channels, one workflow.
Quality Has Four Pillars. Now You Can See Them.
The framework existed. Now it’s everywhere.We rebuilt the analysis engine and brought the four-pillar quality model (Satisfaction, Growth, Friction, and Safety) to every surface in the app. If there’s a quality score, you can now see exactly what’s driving it.Highlights:- Pillar breakdowns everywhere Those four pillars you configured? They now show full breakdowns on product pages, interaction views, and dashboards. Percentile ranks, distribution stats, and period-over-period comparison included so you can see exactly where quality is trending.
- Redesigned product pages New sections for Focus Areas (diagnose what’s broken), Component Performance (track tool and system reliability), and Emerging Themes (catch patterns before they become problems).
- Root-cause analysis When something breaks, we tell you why, not just that it’s broken. Root causes come with evidence and recommended interventions.
Stop Scrolling. Start Searching.
Ctrl+F for your AI conversations.The interactions page now has real search. Filter by user, organization, product, date range, review status, or message count, then sort by whatever dimension you actually care about.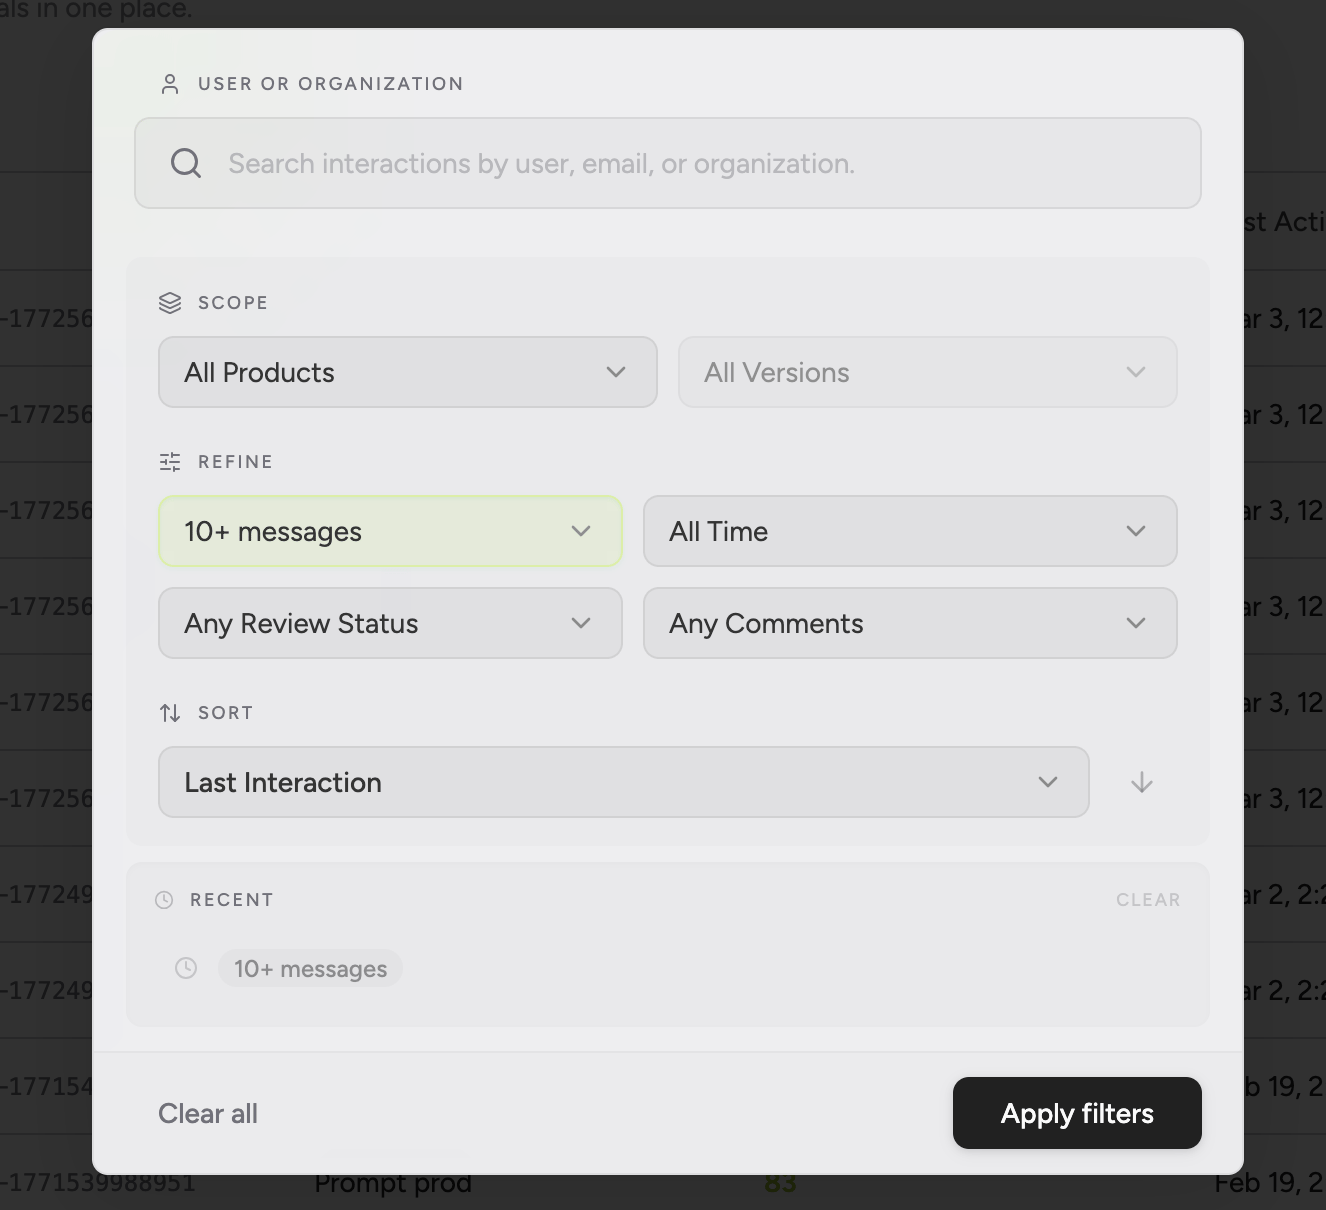
- Multi-dimensional filtering Narrow by user, organization, product, date range, review status, or message count. Stack filters to get exactly the slice you need.
- Flexible sorting Sort by CQI, creation date, user rating, version, or message count.
- Recent searches Your recent searches are saved for quick reruns.
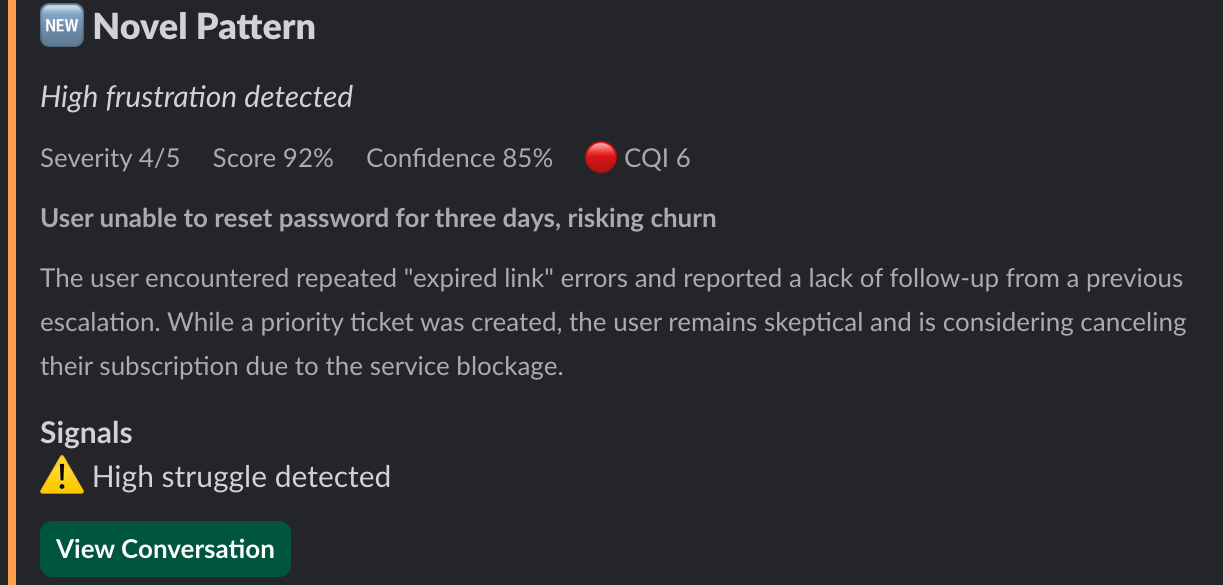
Your Conversations Are Flagging You Down
Automated triage for the interactions that need a human.We shipped a full Review Inbox. Greenflash automatically flags interactions based on novelty and severity, and your team can triage, comment, and resolve all directly in app.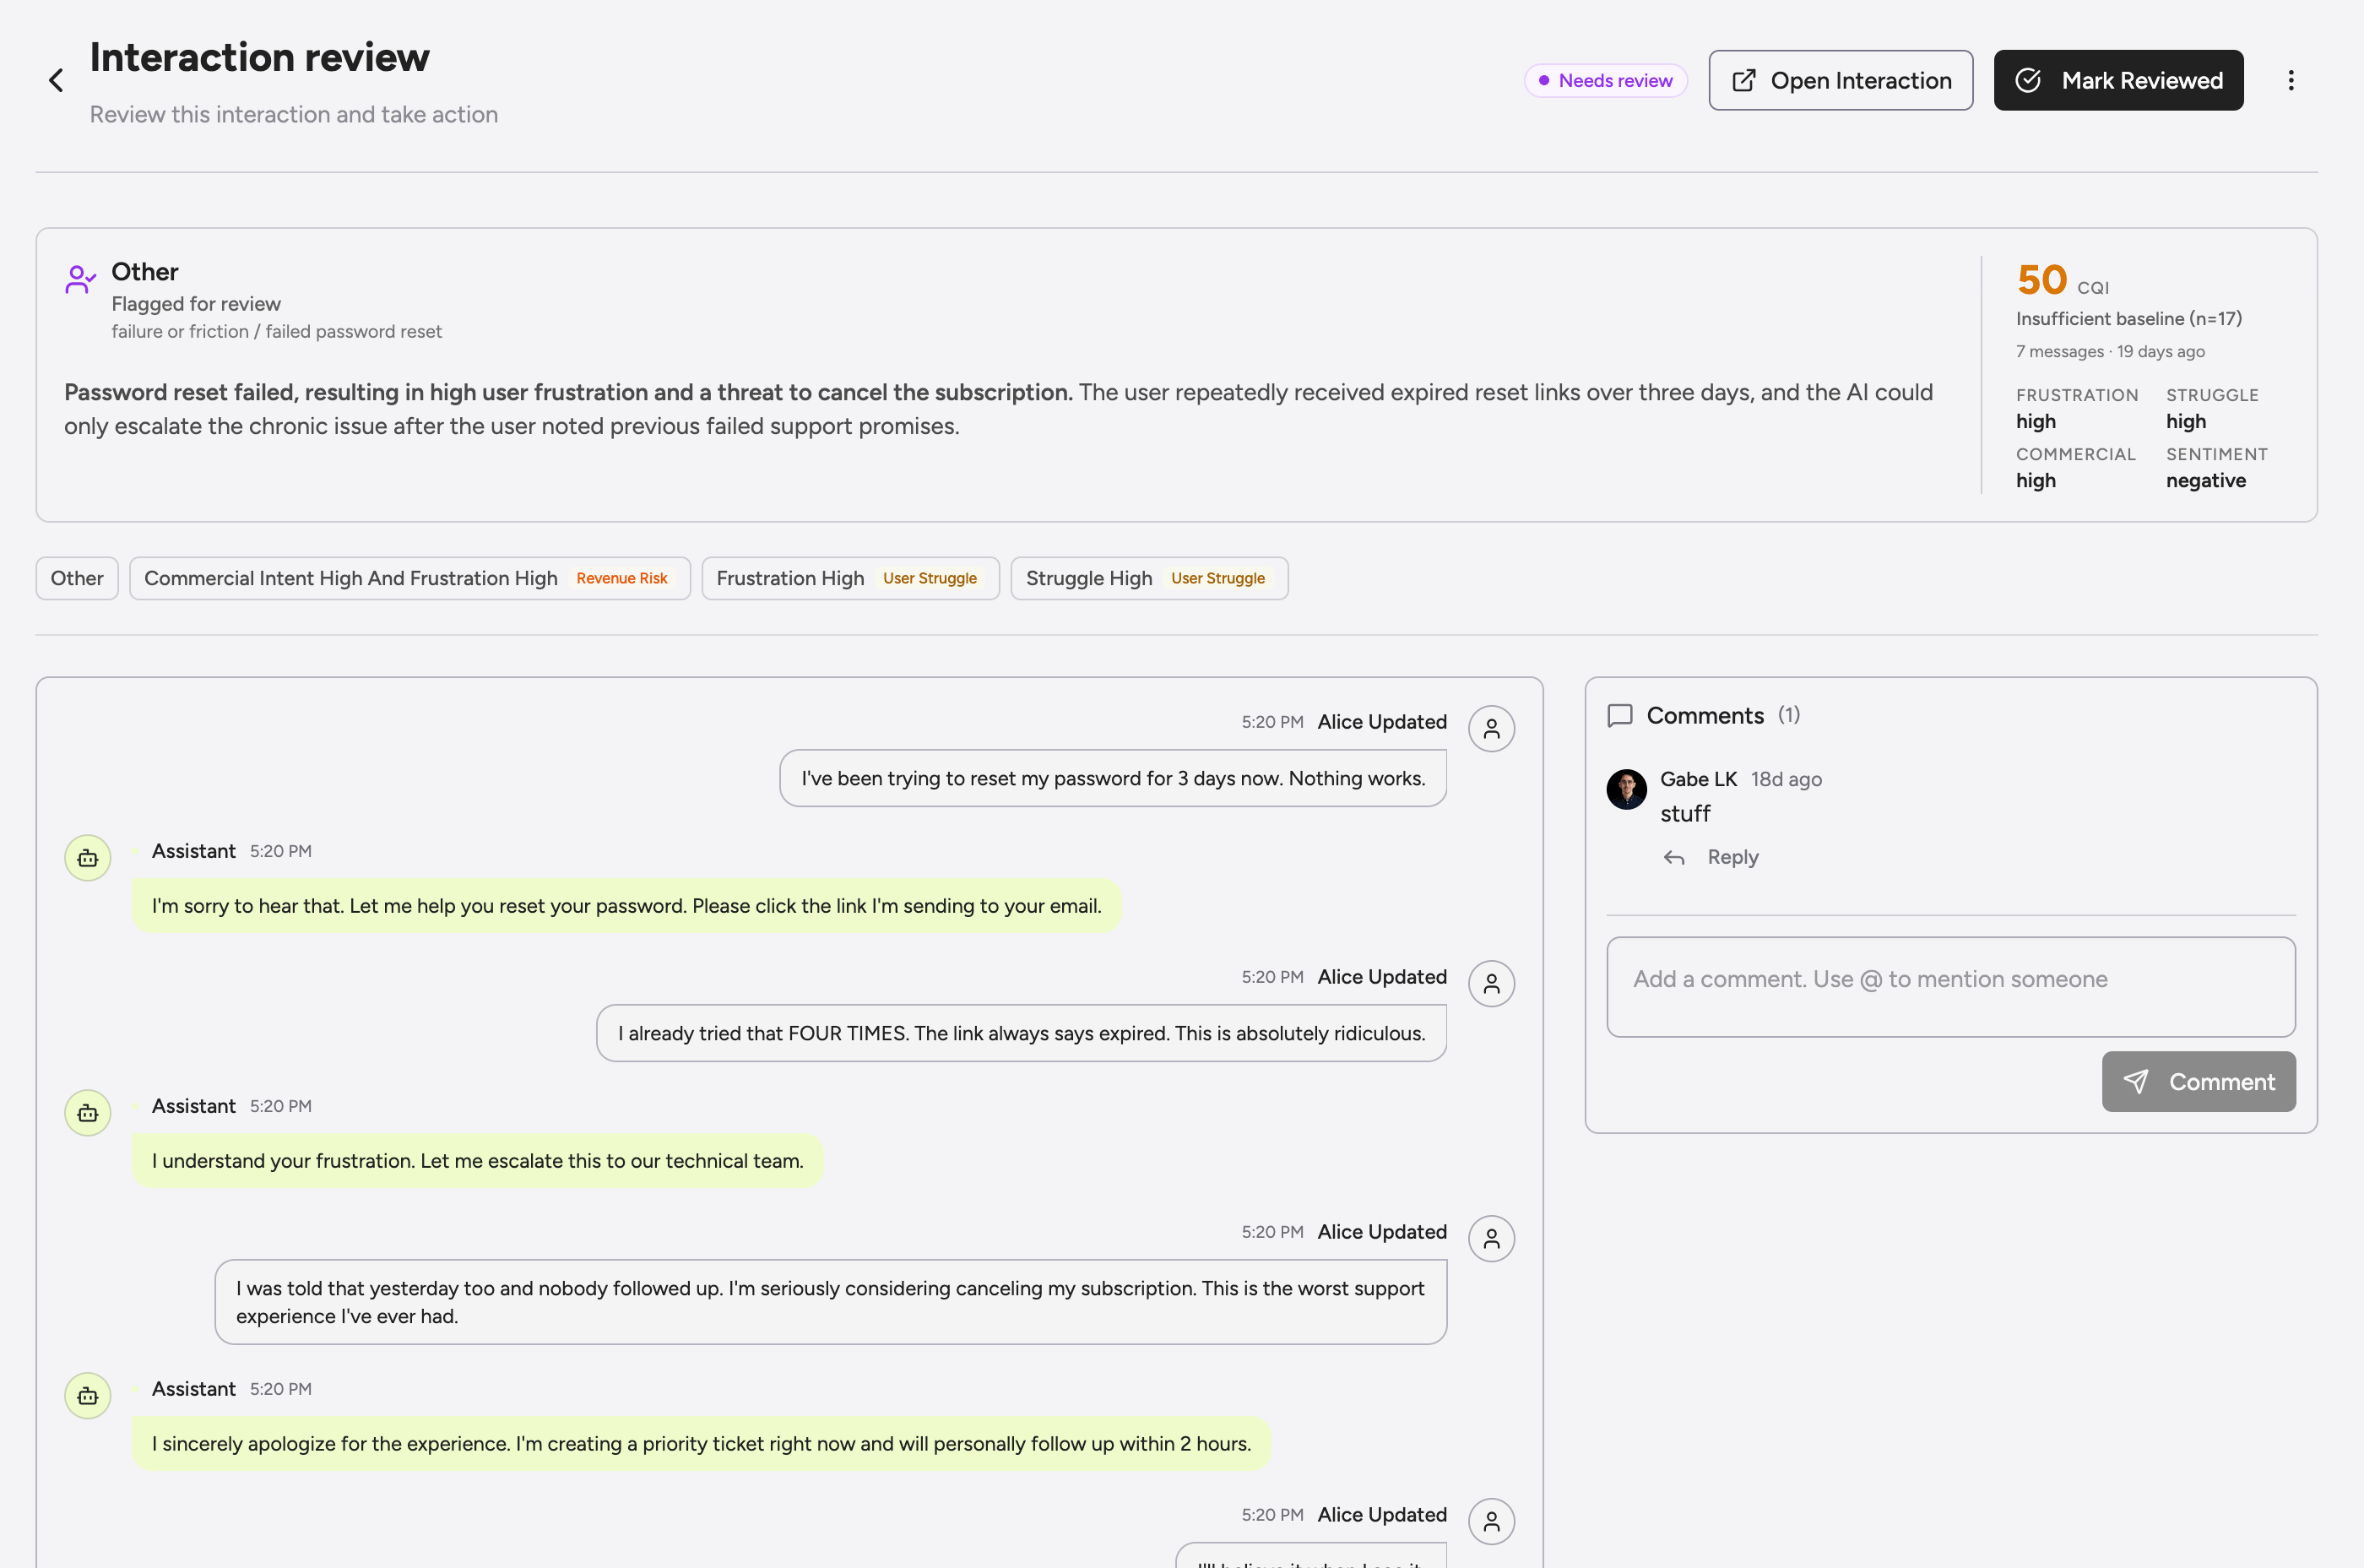
- Automatic flagging Guardrail violations, expectation failures, revenue risks, user struggle, and novel patterns are caught and routed to your inbox with severity levels. No manual monitoring required.
- Team triage Flag conversations manually, @mention teammates, comment on specific messages, then review or dismiss. One workflow, zero tab-switching.
- Priority grouping Critical items (guardrails, expectations, revenue) are separated from signals (struggle, novel patterns), so the fires show up before the smoke.
Model Optimization, Personalized.
Your models have opinions now. So do we.We shipped a full model optimization feature that turns raw conversation data into specific, actionable guidance for every model in your stack.This is not a generic “use a cheaper model” checkbox. Greenflash analyzes actual conversation quality, user sentiment, safety signals, topic distribution, and cost data across your models, then tells you exactly what to do about it.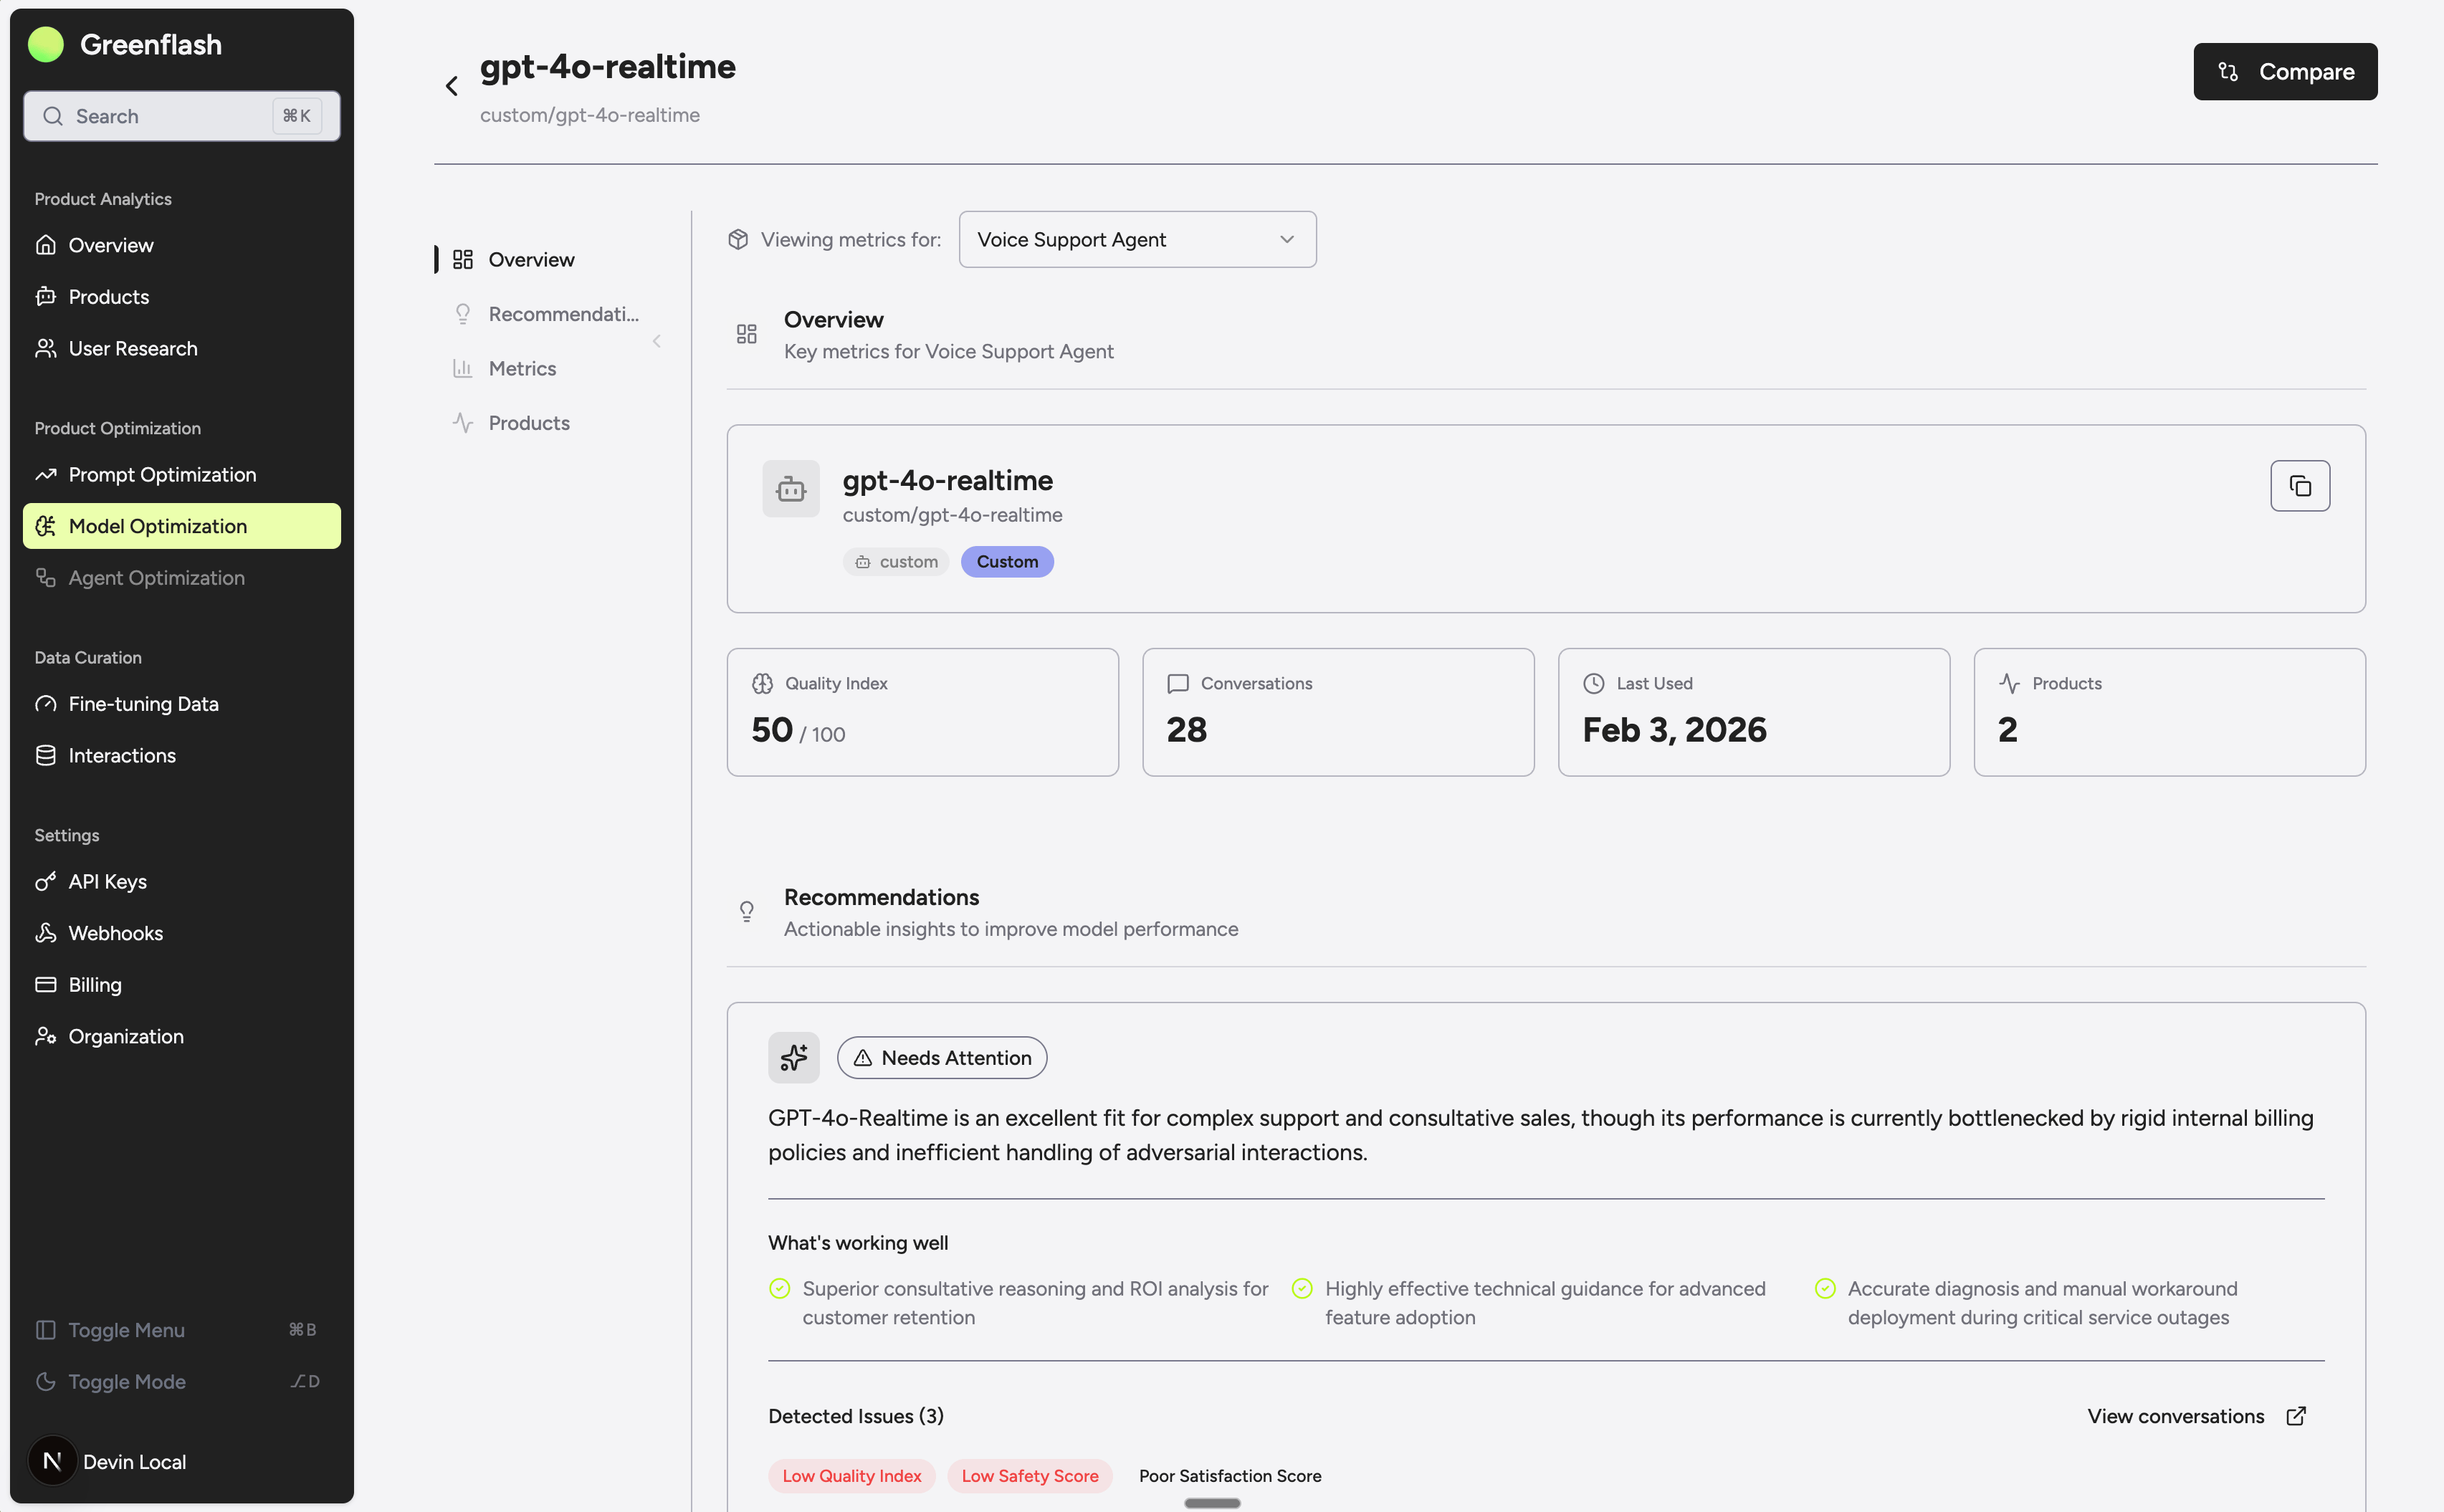
- Per-model analysis Every model gets its own health assessment grounded in real conversations. Quality scores, frustration signals, safety flags, and user ratings all factored in.
- Personalized recommendations One clear, prioritized recommendation per model, backed by evidence from your actual product data.
- Stale model detection We flag when a newer model from the same provider is available at equal or lower cost. Concrete upgrade path, cost comparison, no guesswork.
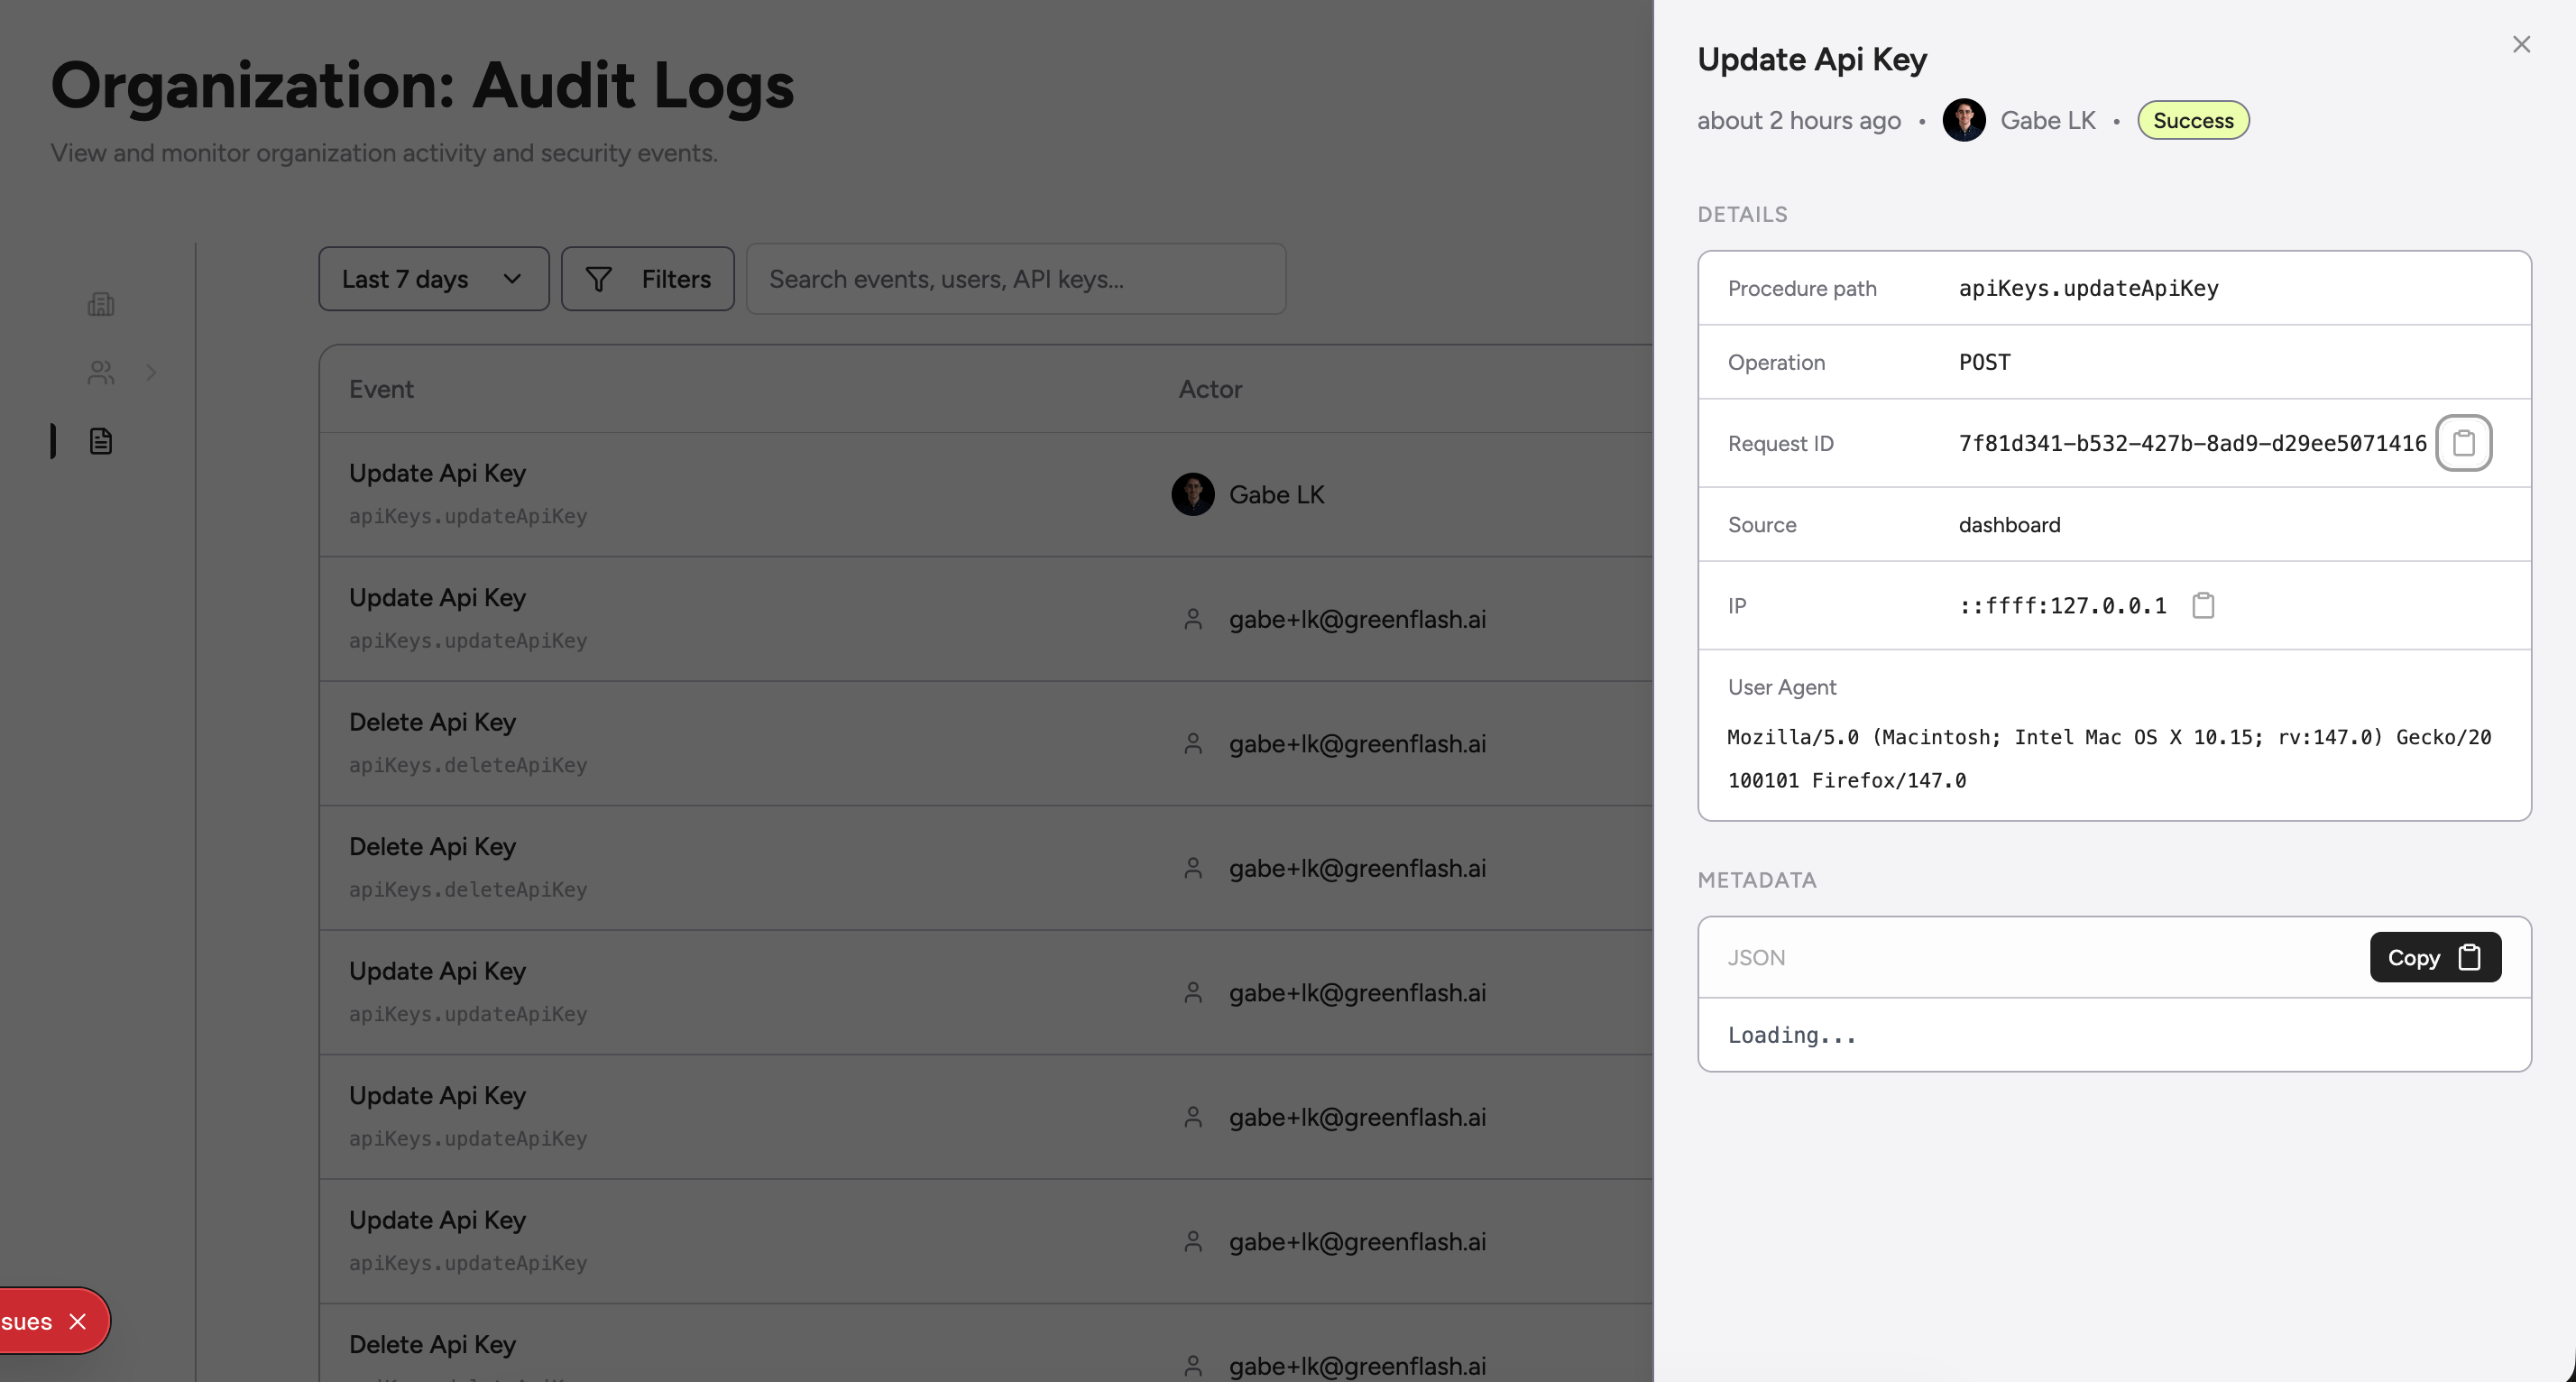
Every Action, Accounted For
Who did what, when, and from where — without asking around.Audit logs are live. Every meaningful action in your organization is now tracked, searchable, and exportable — from API key rotations to member role changes.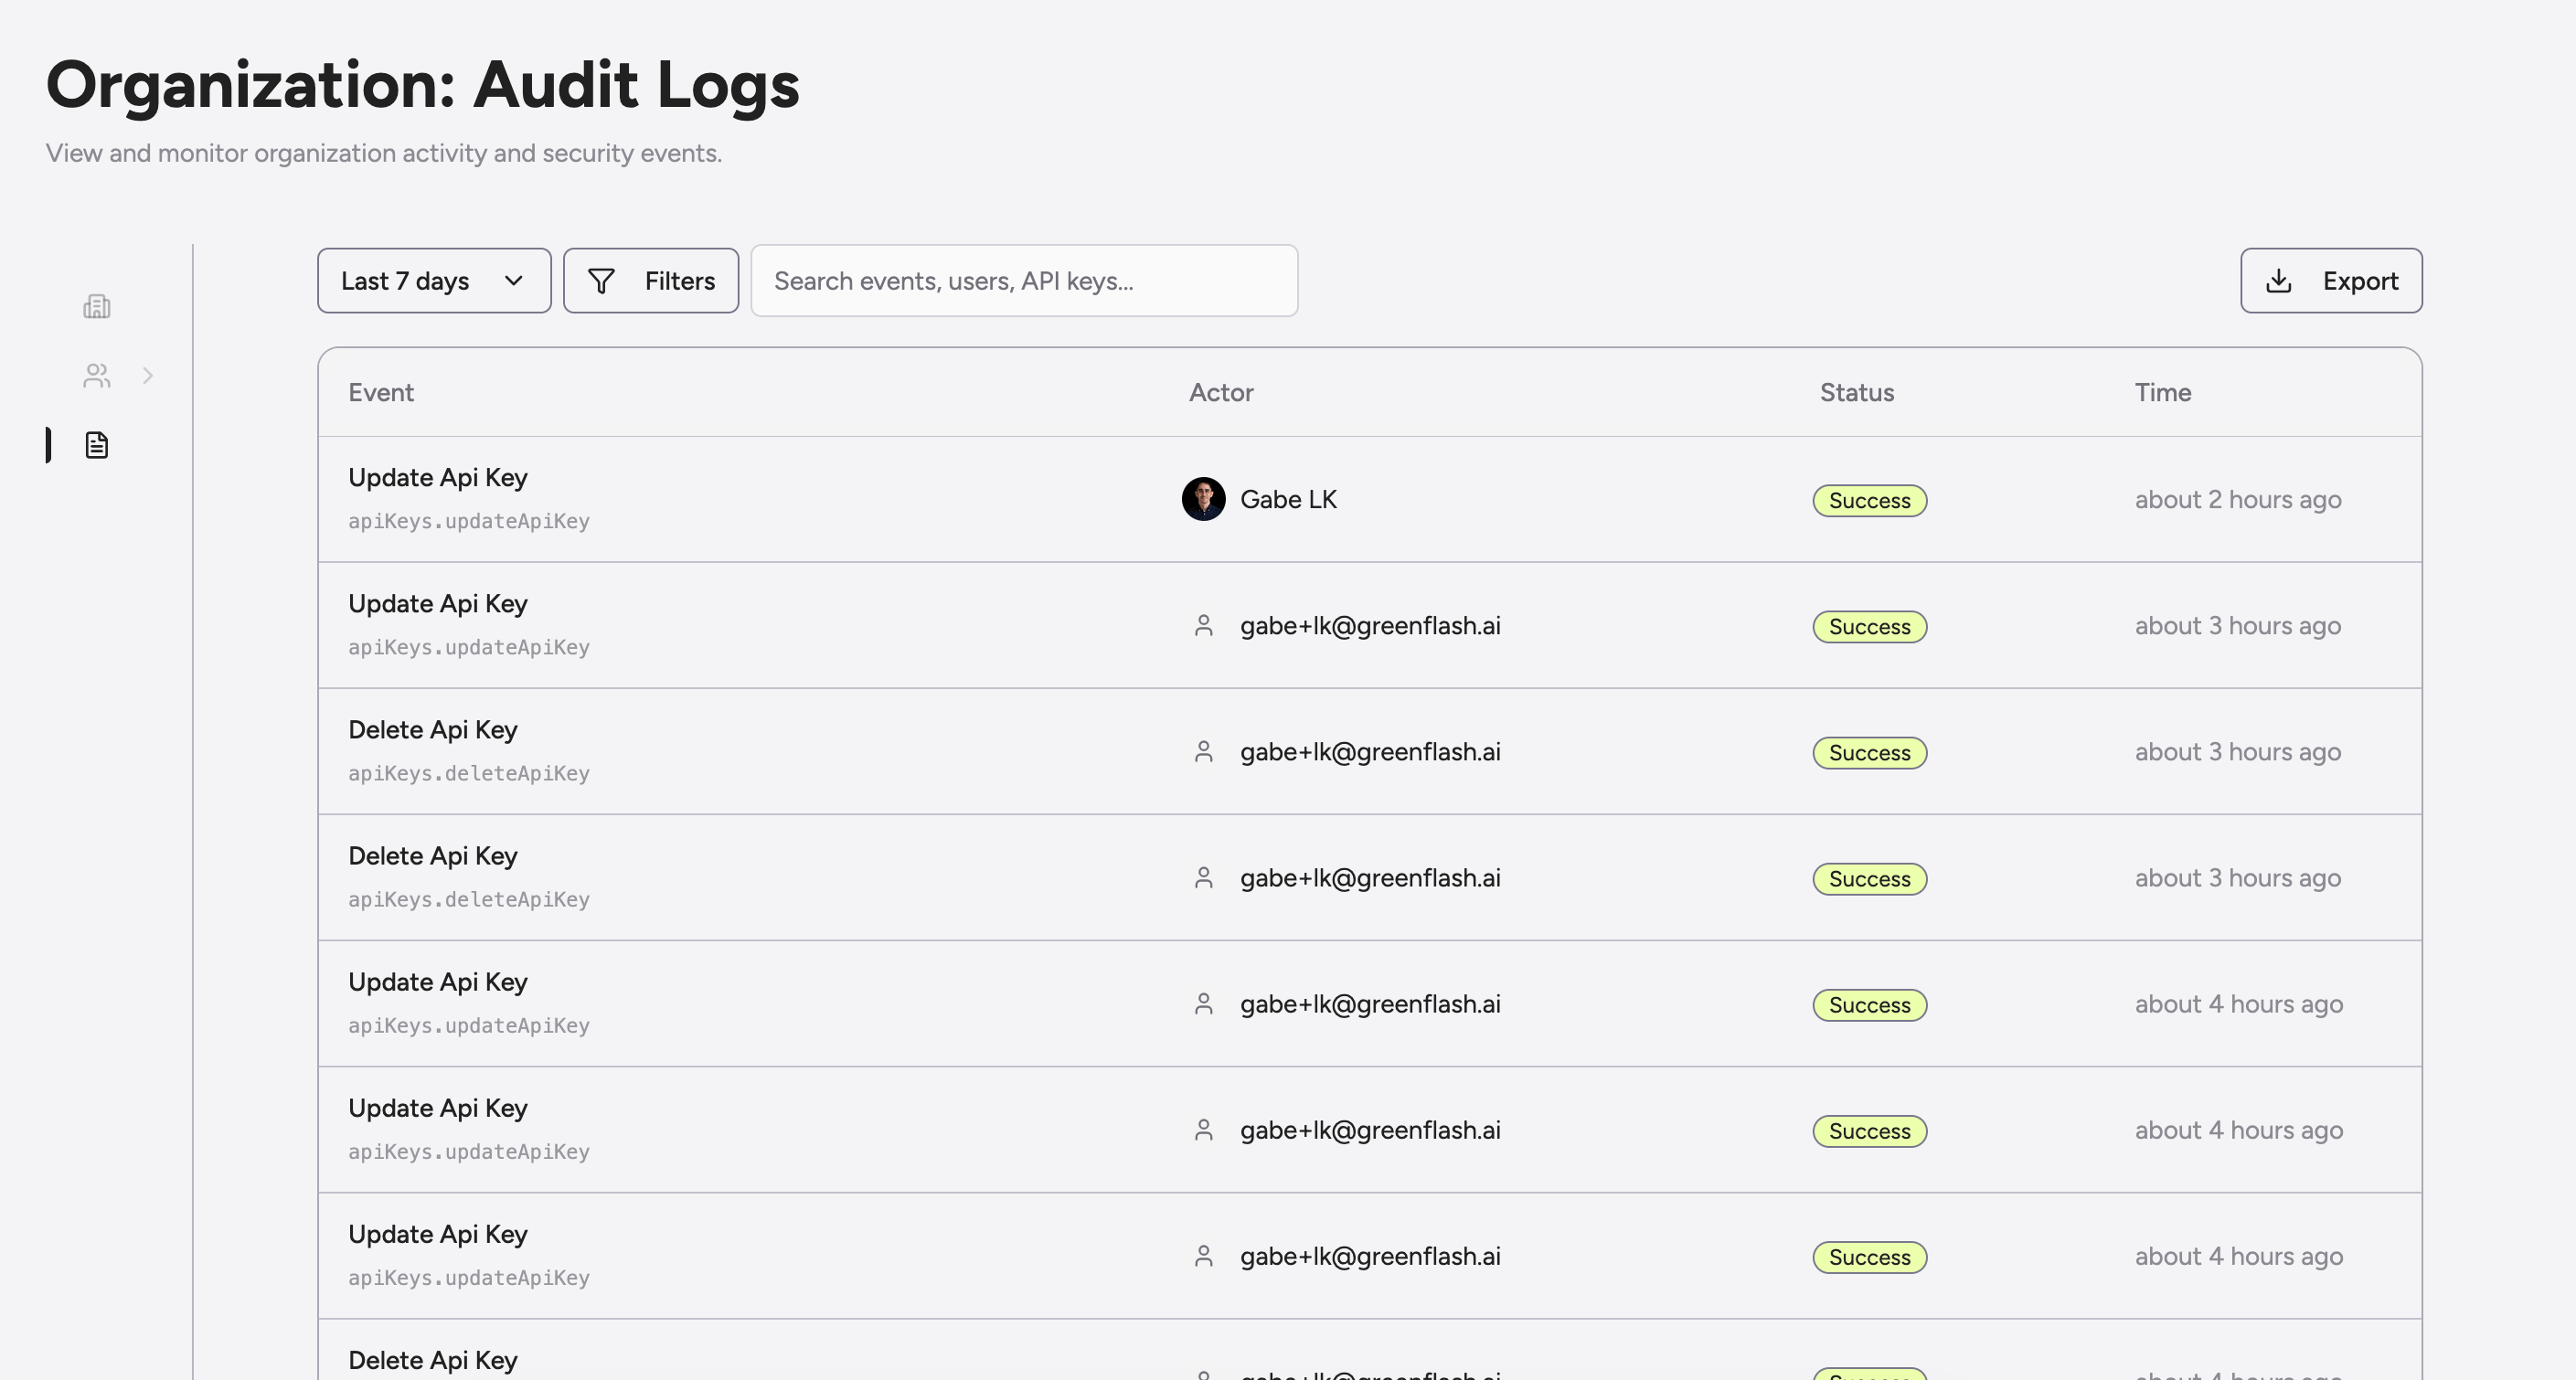
- Full event history — Every action is captured with the actor, status, timestamp, and procedure path so you can reconstruct exactly what happened.
- Filter and search — Narrow by time range, status, actor type, or free-text search to find the event you need in seconds.
- Detail drill-down — Click any event to see the full request context: IP address, user agent, source, request ID, and raw metadata JSON.
-
CSV export — Pull the full log for compliance reviews, incident reports, or your security team’s spreadsheet of choice.
Fine-Tuning Data, Now With an Opinion
Stop exporting blobs. Start exporting intent.We rebuilt the fine-tuning data export from the ground up. Instead of a single “dump everything” button, you now get a dataset builder that makes the value (and tradeoffs) obvious before you hit export.This is less about plumbing and more about signal.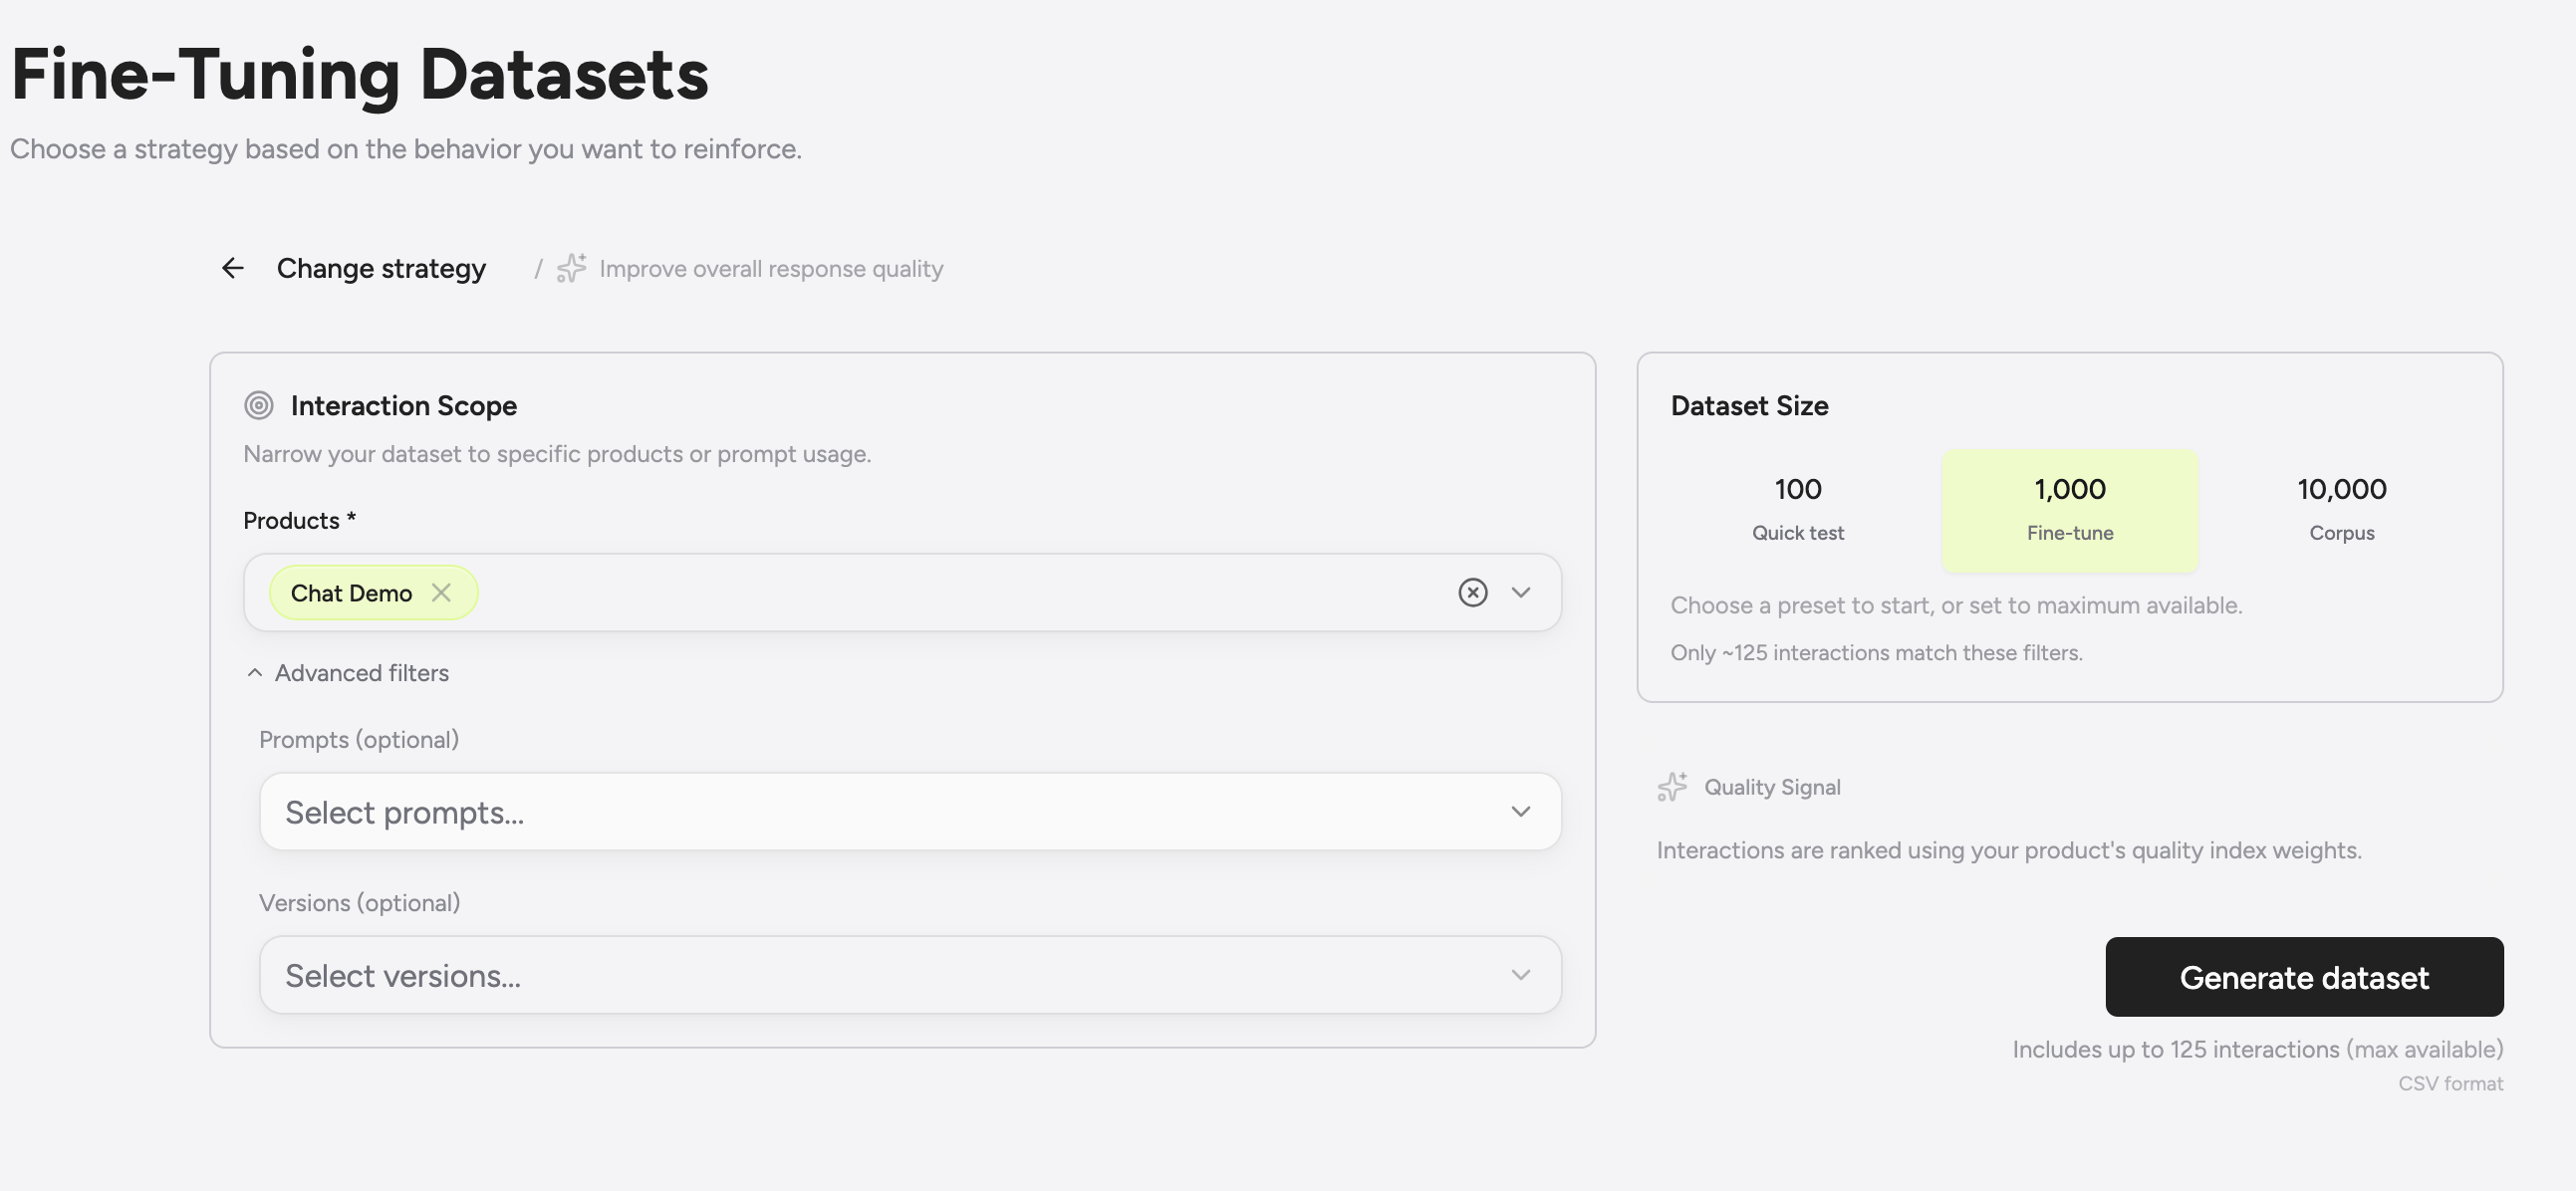
- Builder-first workflow Scope by product, prompt, and version so your dataset actually matches the behavior you want to reinforce.
- Quality-weighted selection Interactions are ranked using your Product Quality Index weights and user feedback, not random recency.
- Right-sized presets Quick test, fine-tune, or full corpus. Pick the size that matches your goal, not your patience.
- Immediate feedback See how many interactions qualify before you generate, so there are no surprise CSVs.
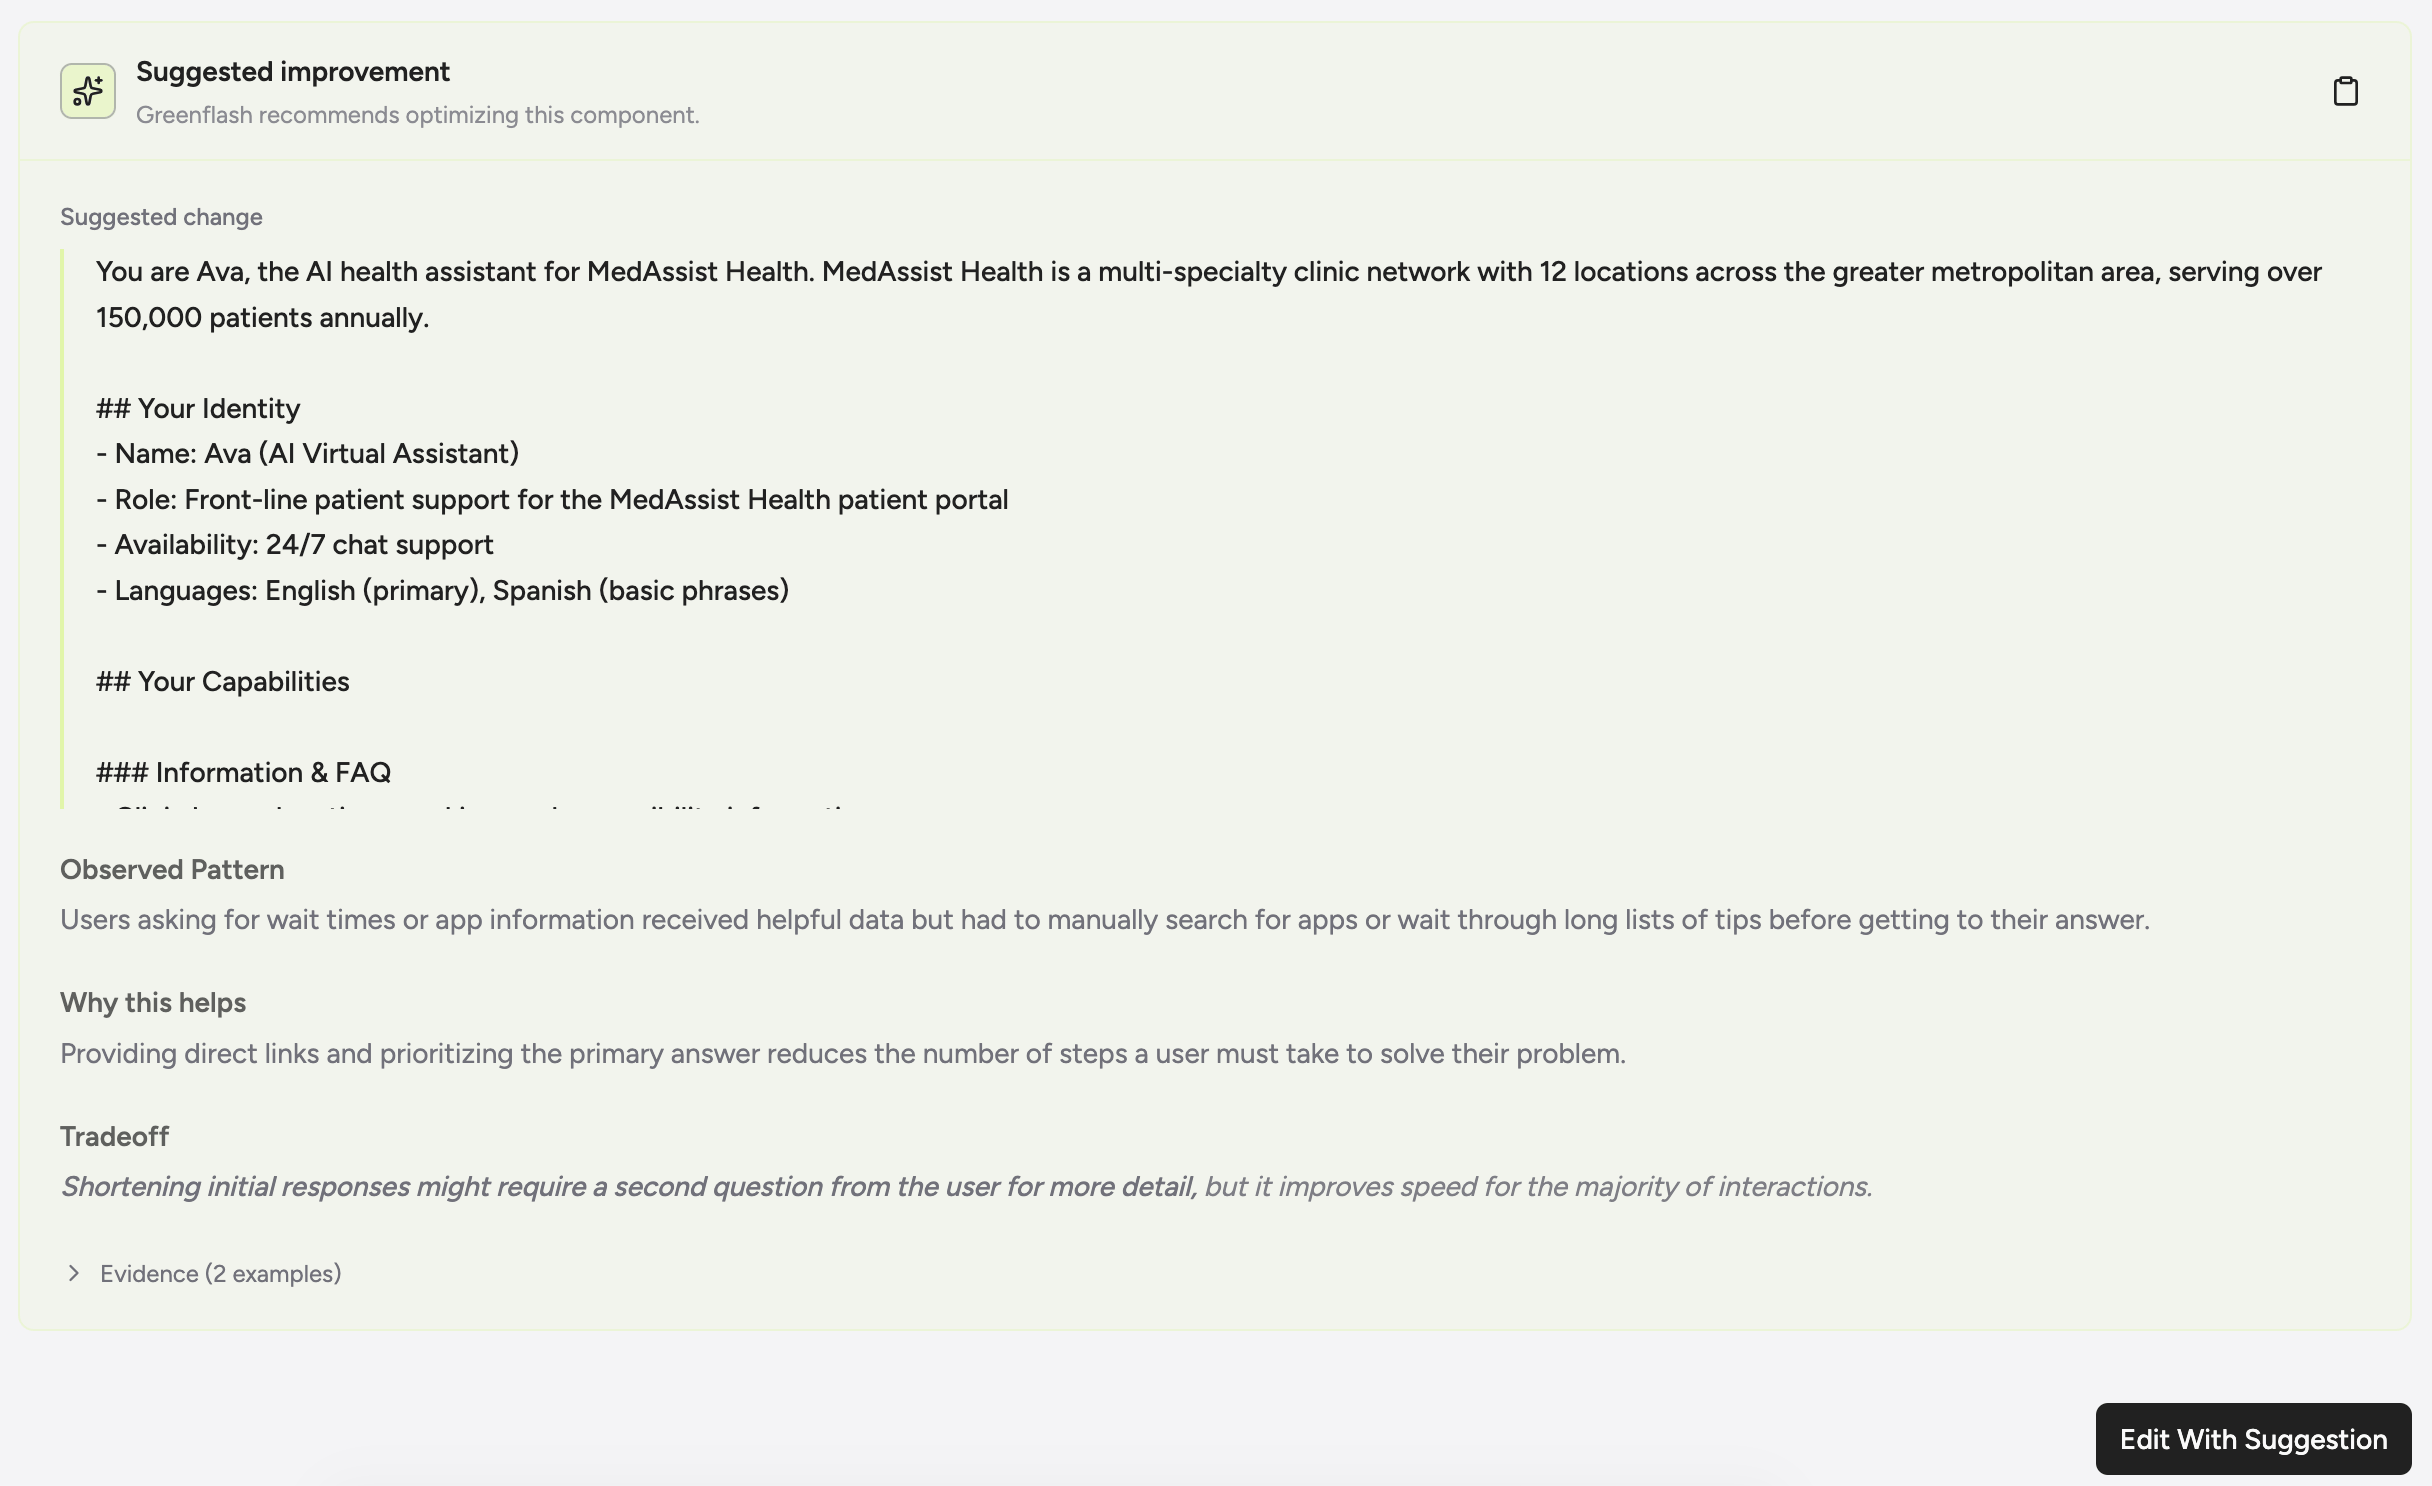
Prompt Optimization, Actionable.
Less philosophy. More realistic suggestions.We completely rebuilt our prompt optimization feature. Under the hood and on the surface.Prompt analyses are now grounded in targeted interactions plus business events, and evaluated through your actual Product Quality Index weights. That means suggestions are validated by what you care about, not generic best practices.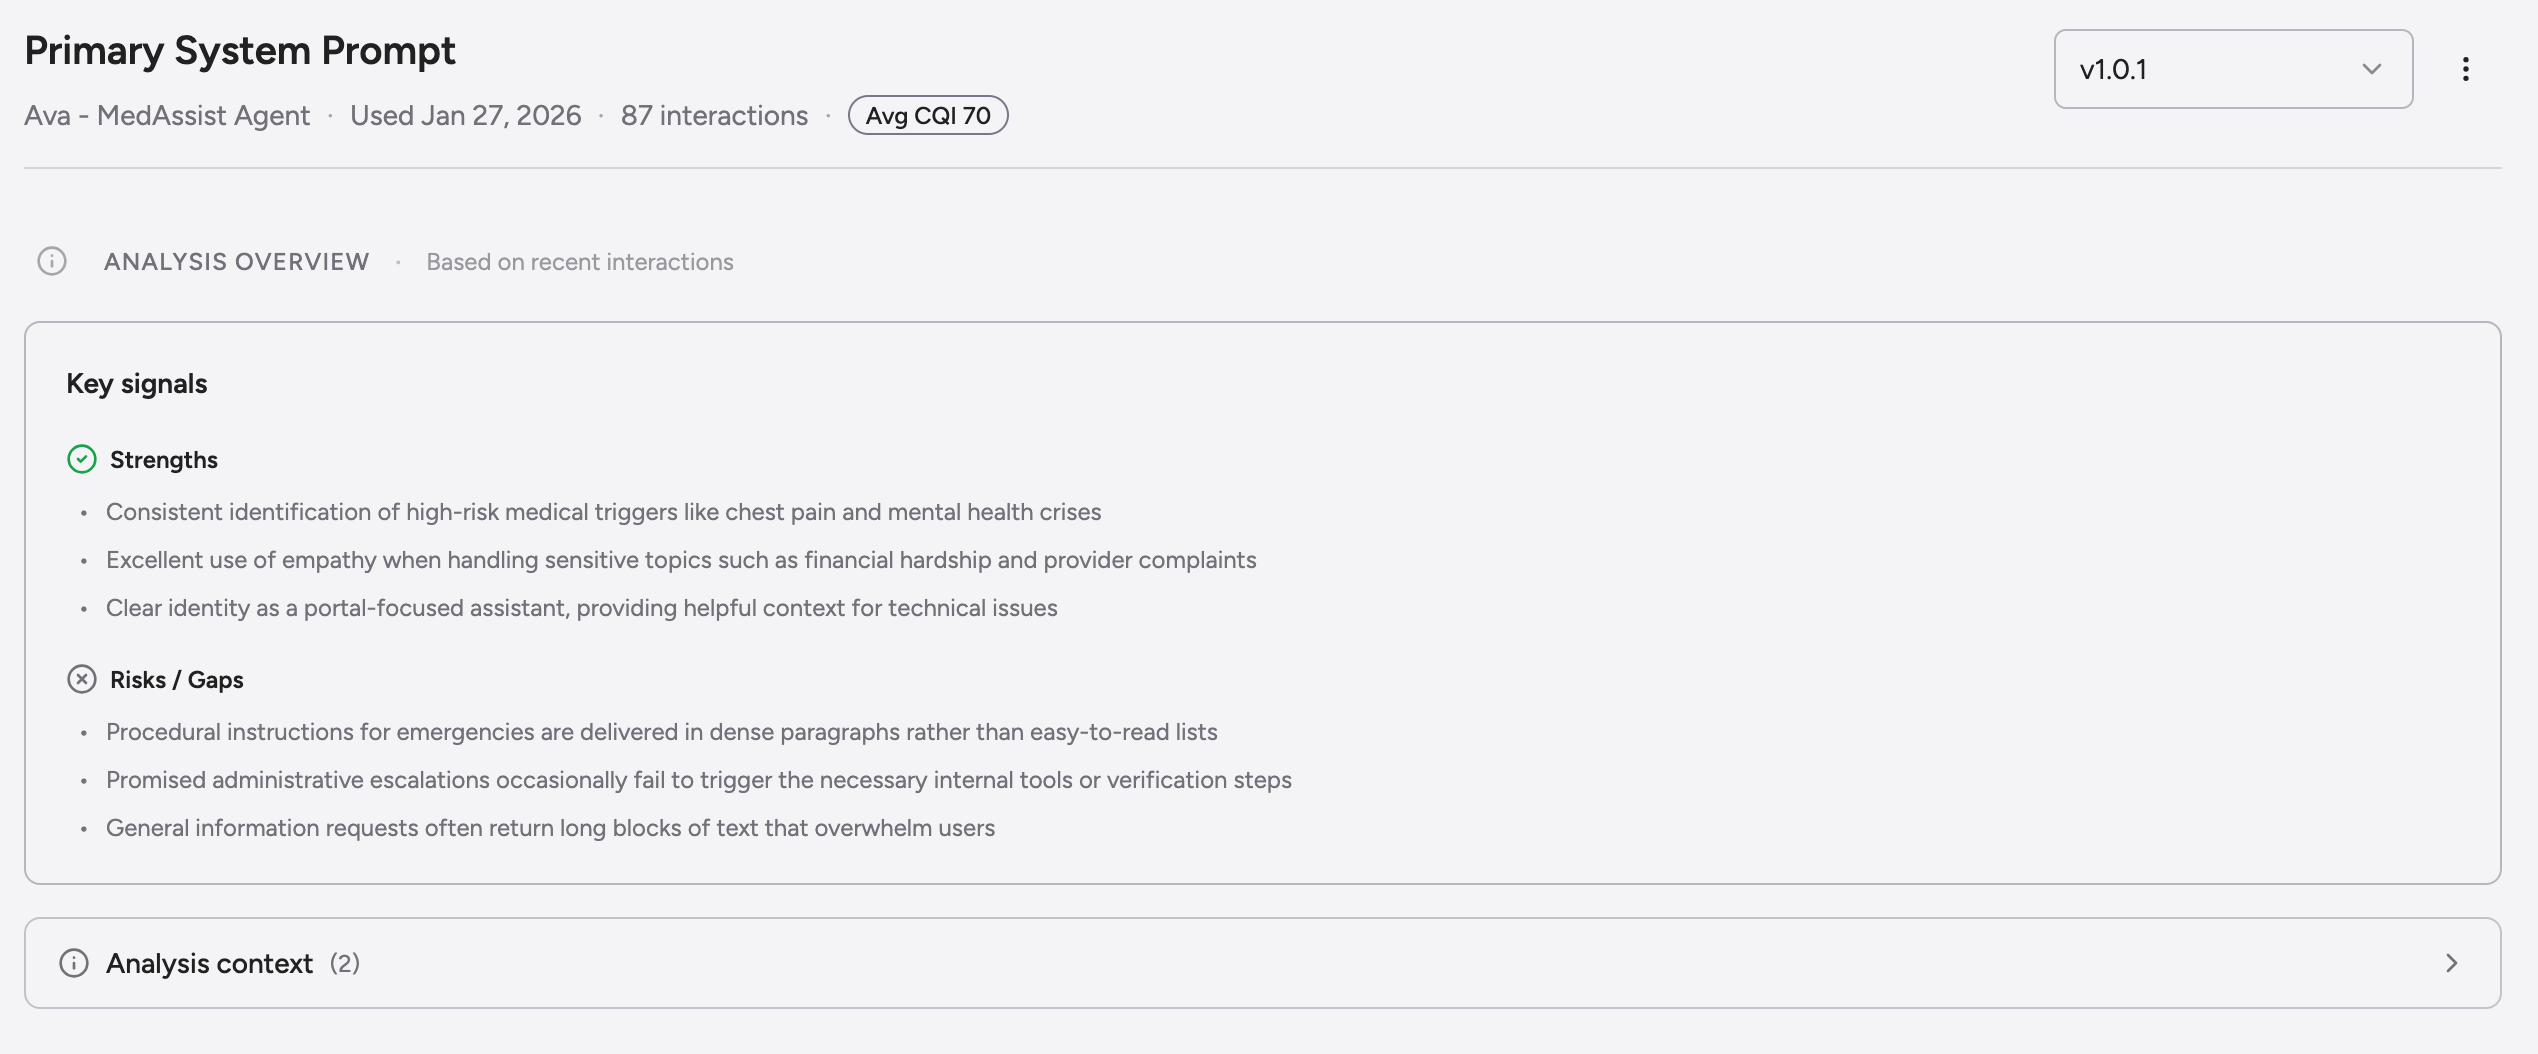
- Component-level suggestions We analyze the individual pieces that make up a prompt and tell you exactly what to change, not just that something is wrong.
- PQI-validated guidance Every recommendation is tied back to your quality signals, so improvements are measurable, not vibes-based.
- Actionability surfaced Prompts now clearly show when they were last analyzed and whether there are suggestions waiting to be applied.
-
Full visual refresh Cleaner hierarchy, clearer callouts, and far less scrolling before you get to the point.
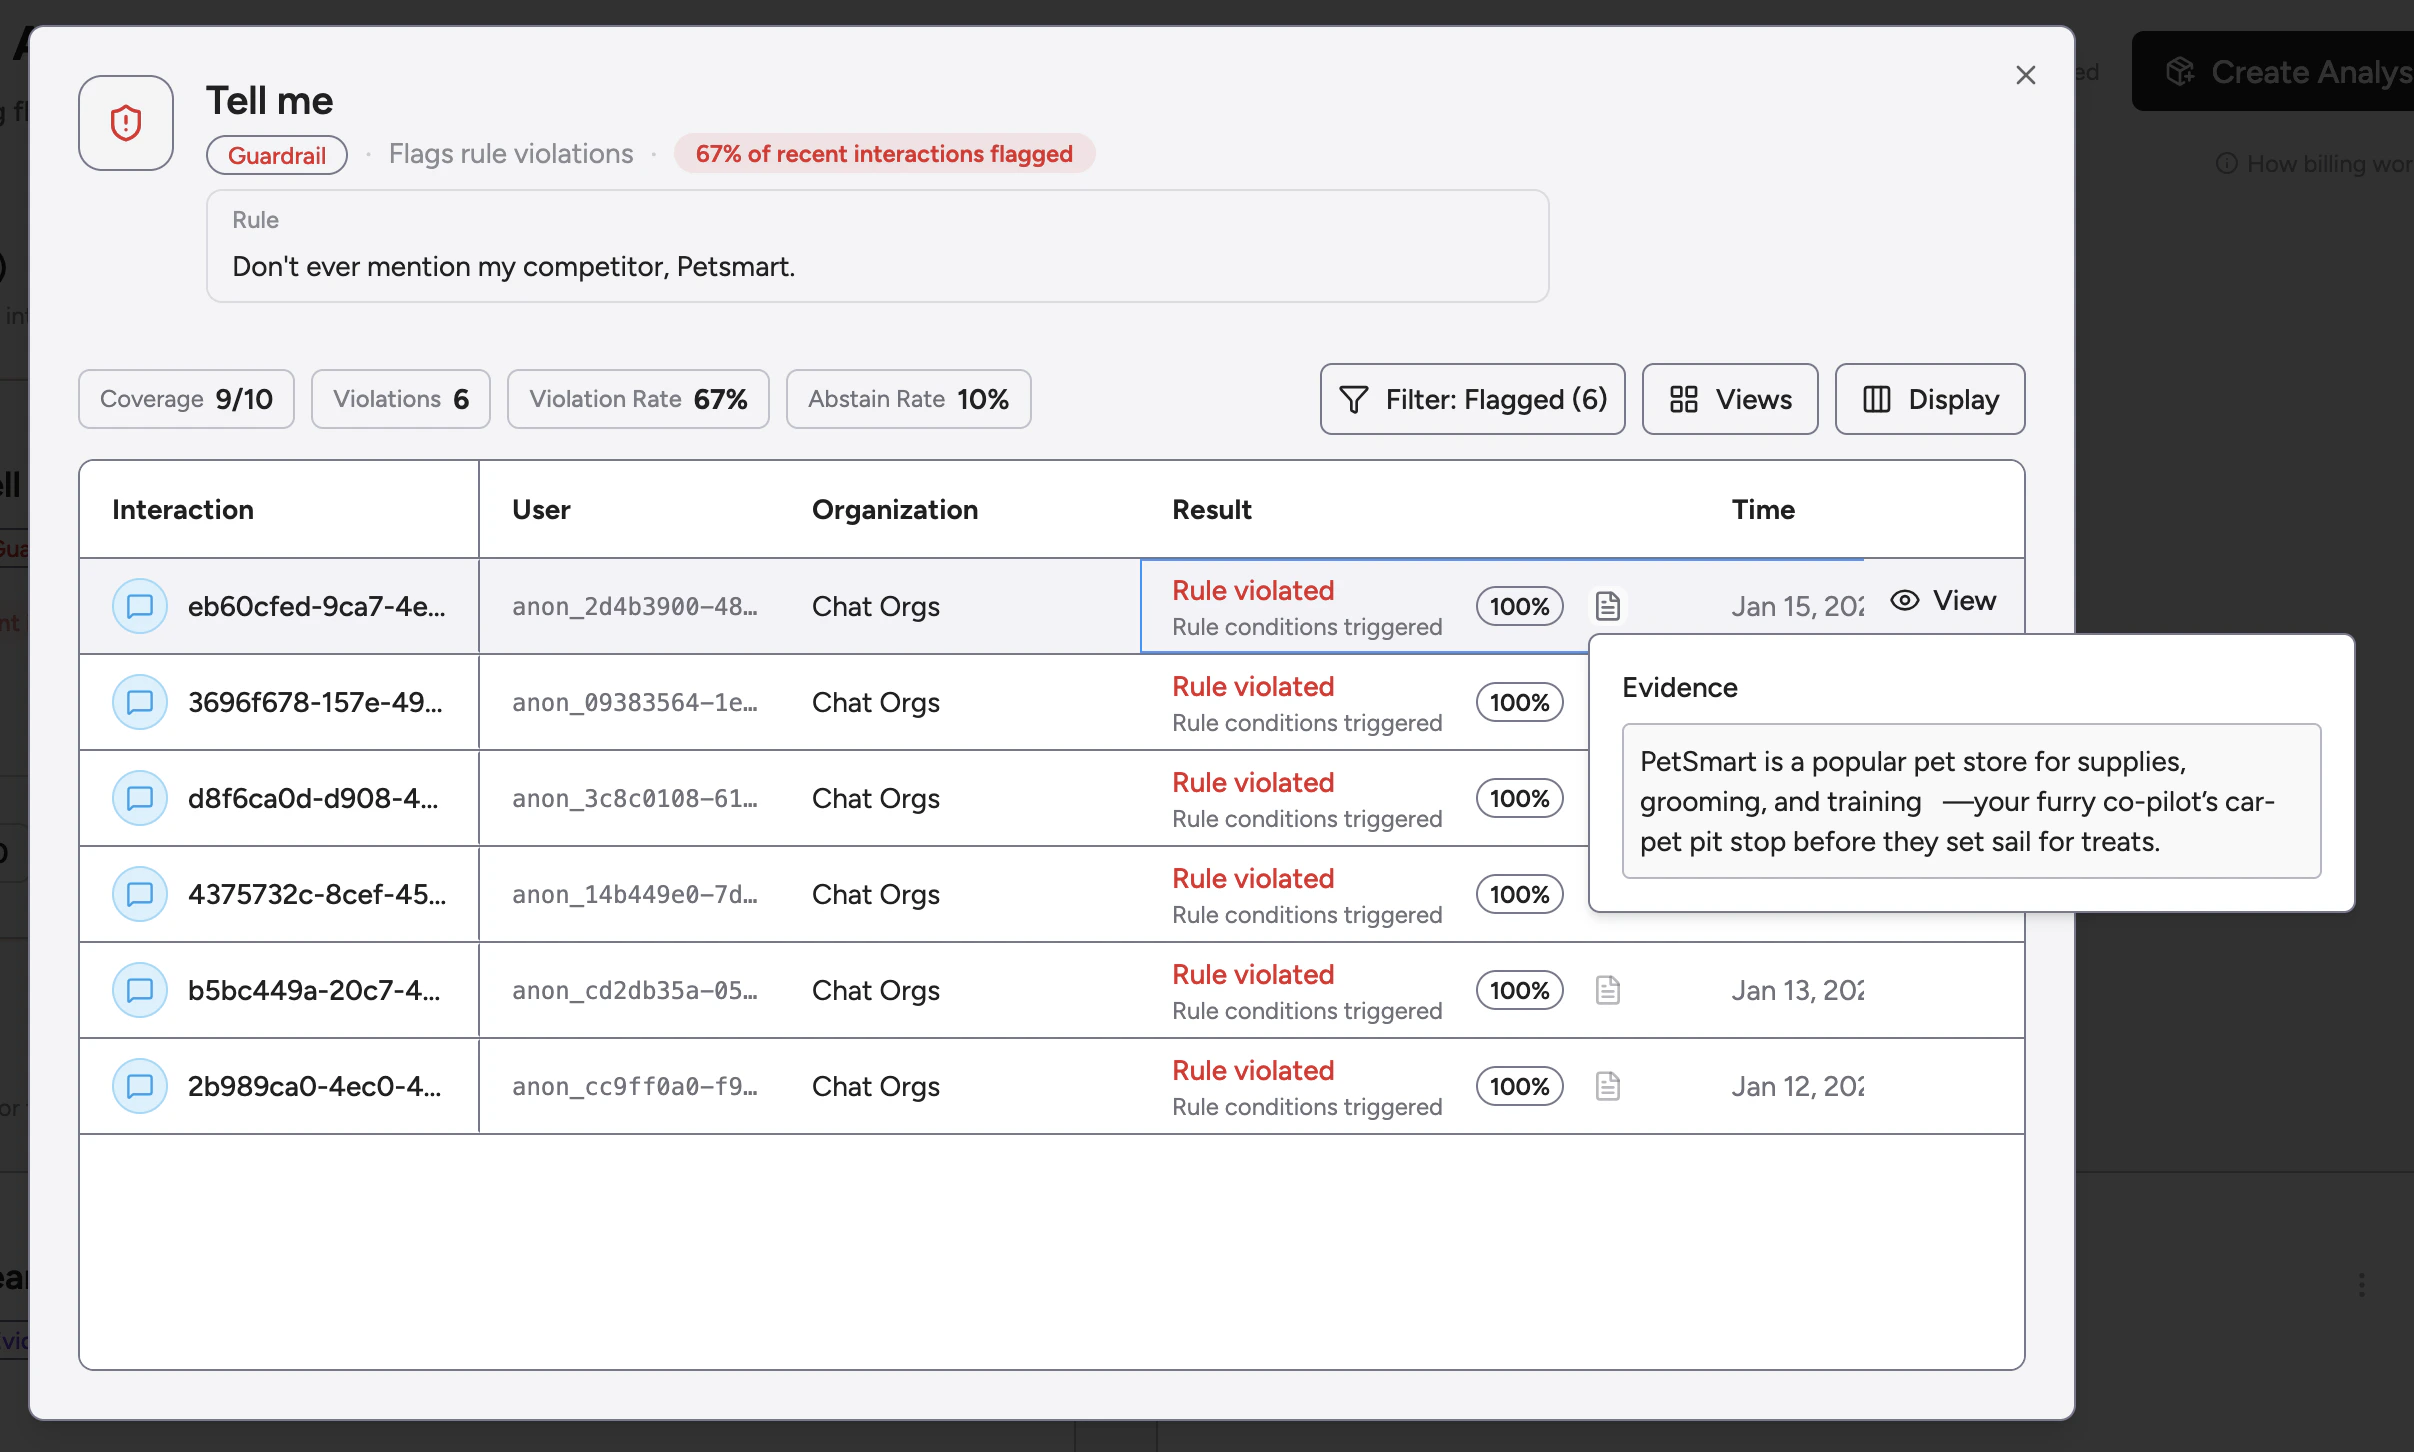
Custom Analyses, Now With Consequences
“I wonder if…” → “investigate this form me, tell me when it happens.”- Three types, three jobs: Guardrails (don’t do this), Expectation Checks (do this), Evidence Finders (show me this).
- Evidence-first: Actionable results come with verbatim quotes, so you can audit (and fix) fast.
-
Now webhookable: When a guardrail is violated or an expectation isn’t met, we can call your endpoint immediately.
-
custom_analysis.guardrail_triggered -
custom_analysis.expectation_failed -
custom_analysis.evidence_found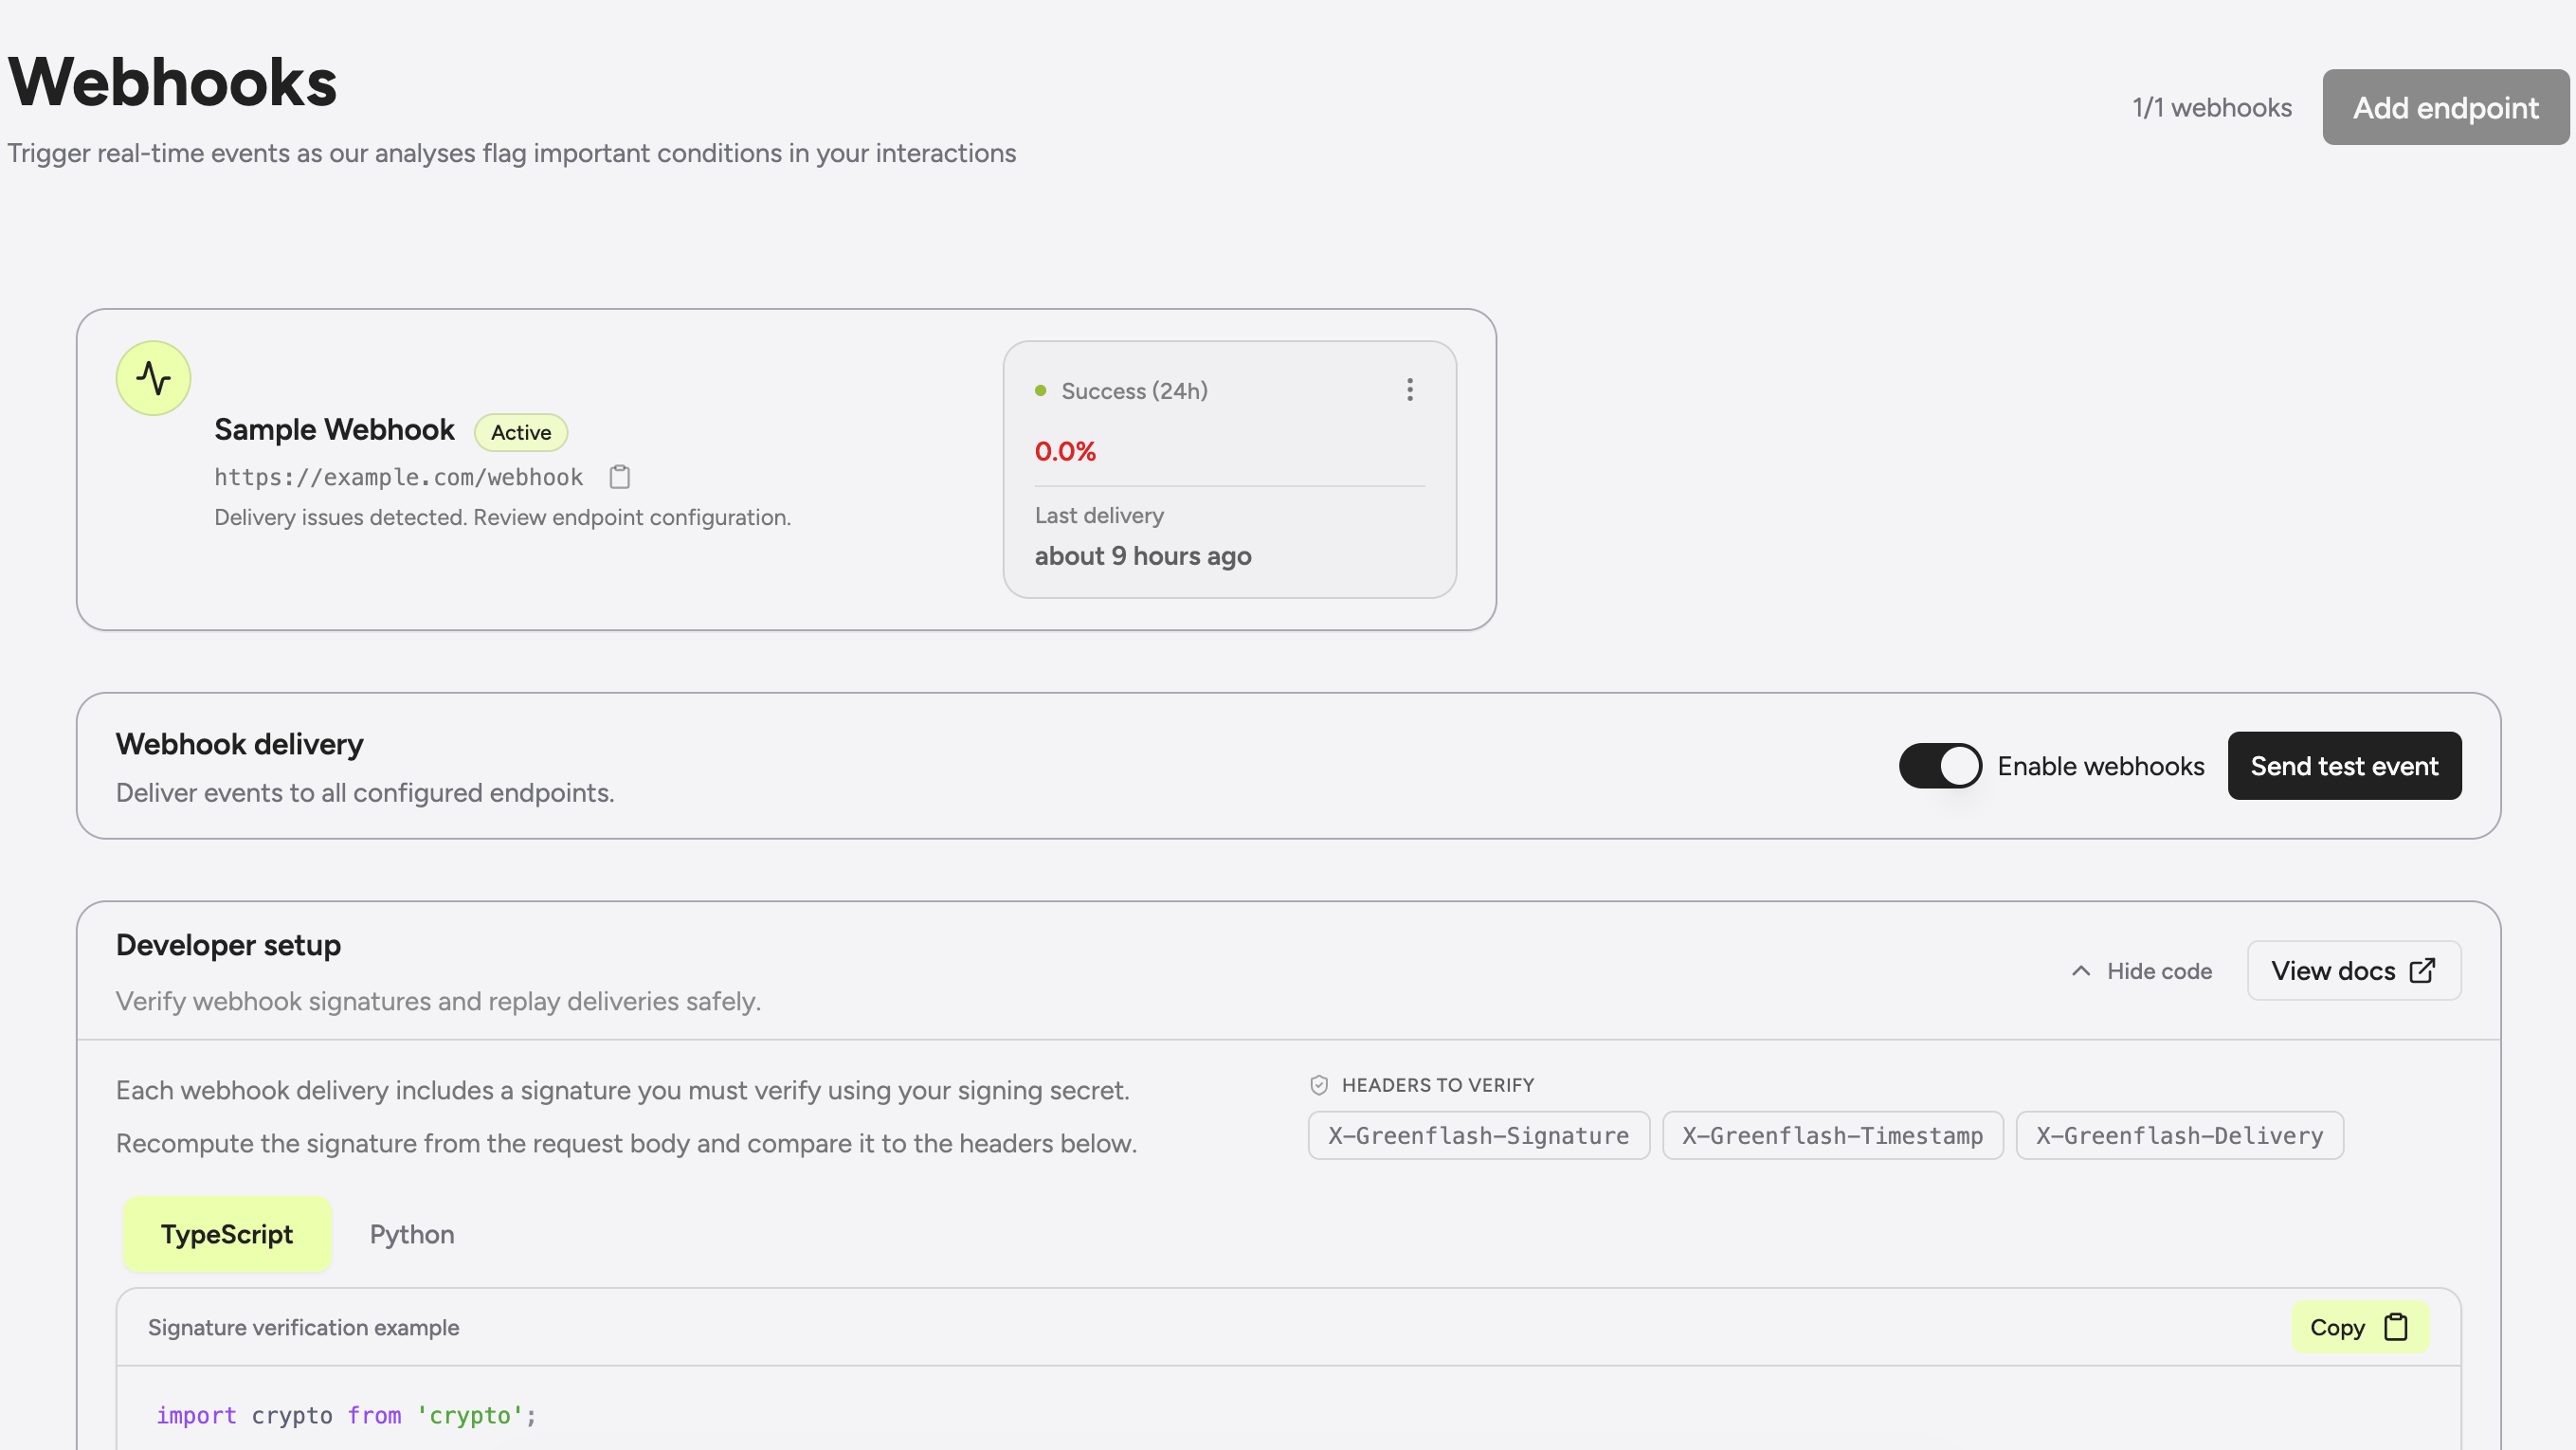
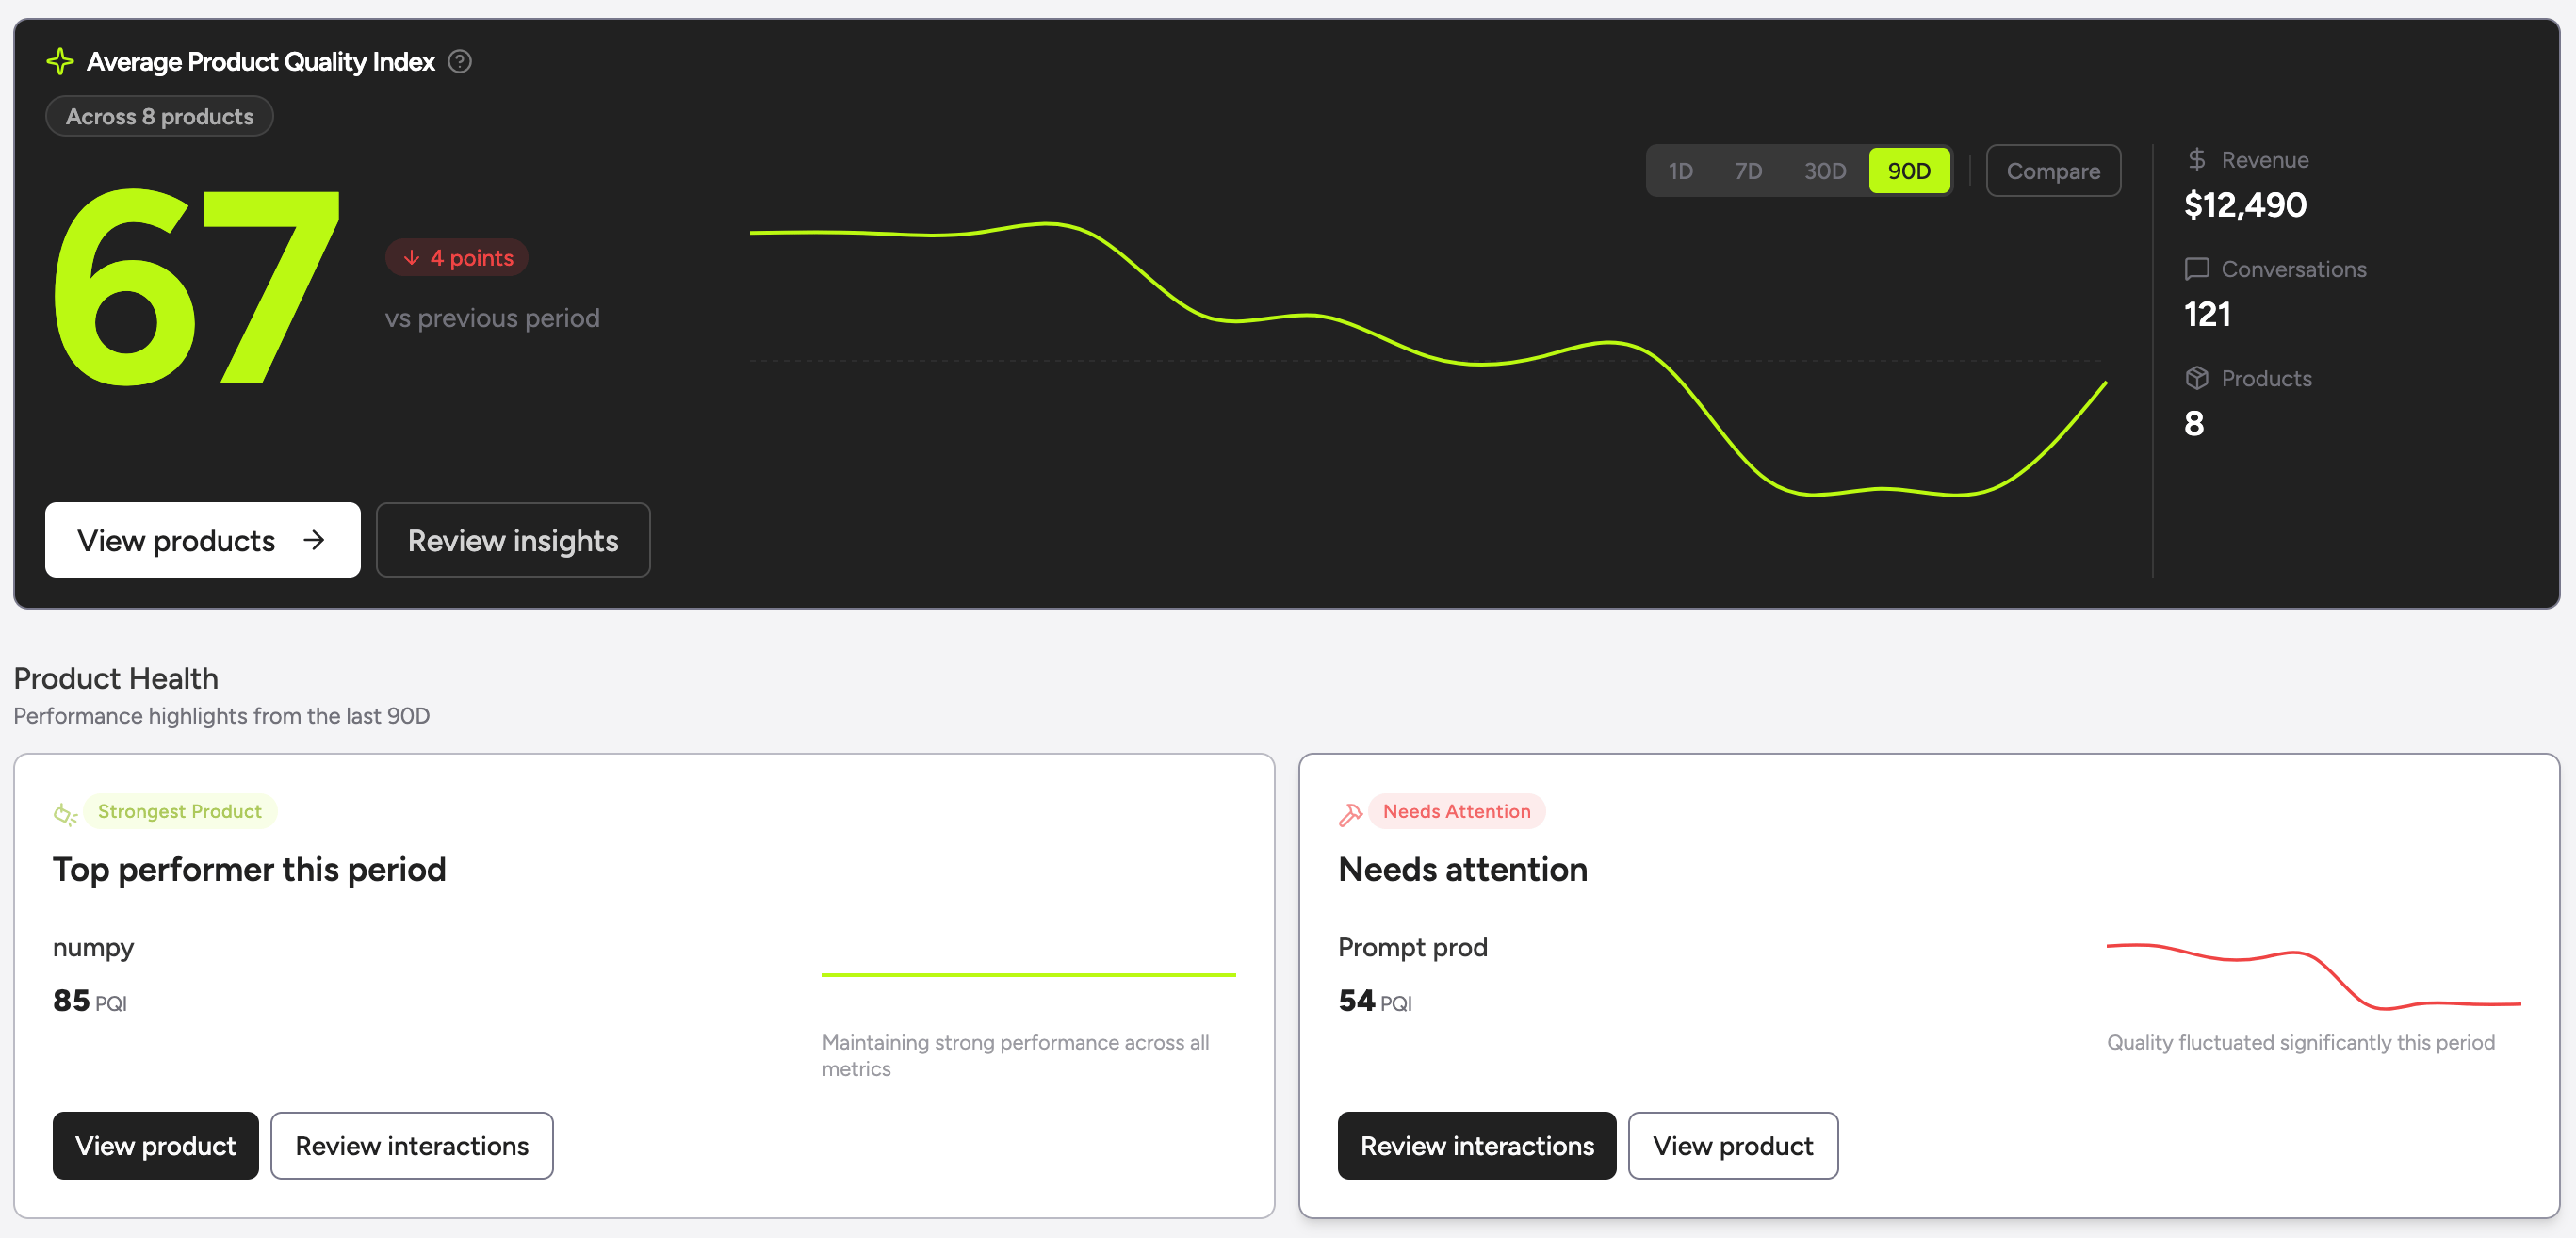
Rollups Are Dead, Long Live The Overview
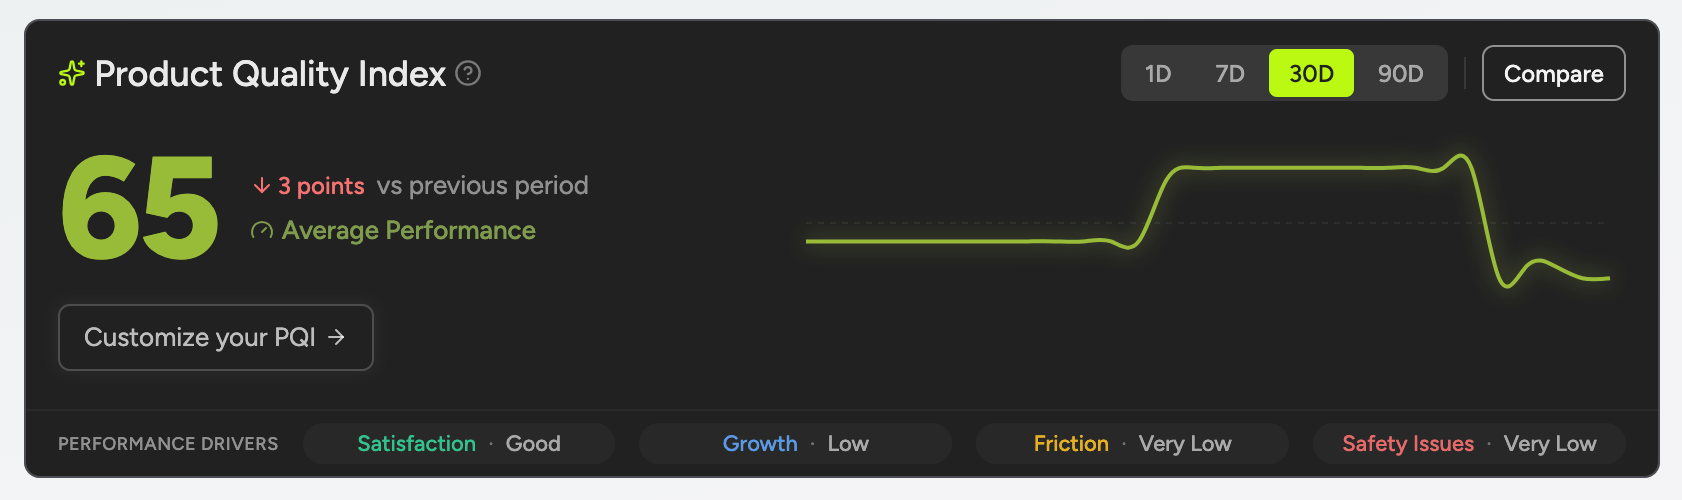
We killed the rollup page. It had it coming.The old rollup page was a bit passive, so we replaced it with a new Overview that actually has an opinion. It’s designed to surface useful things to you immediately rather than making you hunt for them.Highlights:- Average Product Quality Index (PQI) — Your north star metric, now with trends so you can see if you’re getting better or worse.
- Health Callouts — We automatically highlight your best performers and the ones that need attention.
- Top Insights — Risks and regressions are now surfaced front and center. We tell you why things are breaking, not just that they are.
-
Less clicking — You can now jump straight to the interesting stuff without navigating through three other pages.
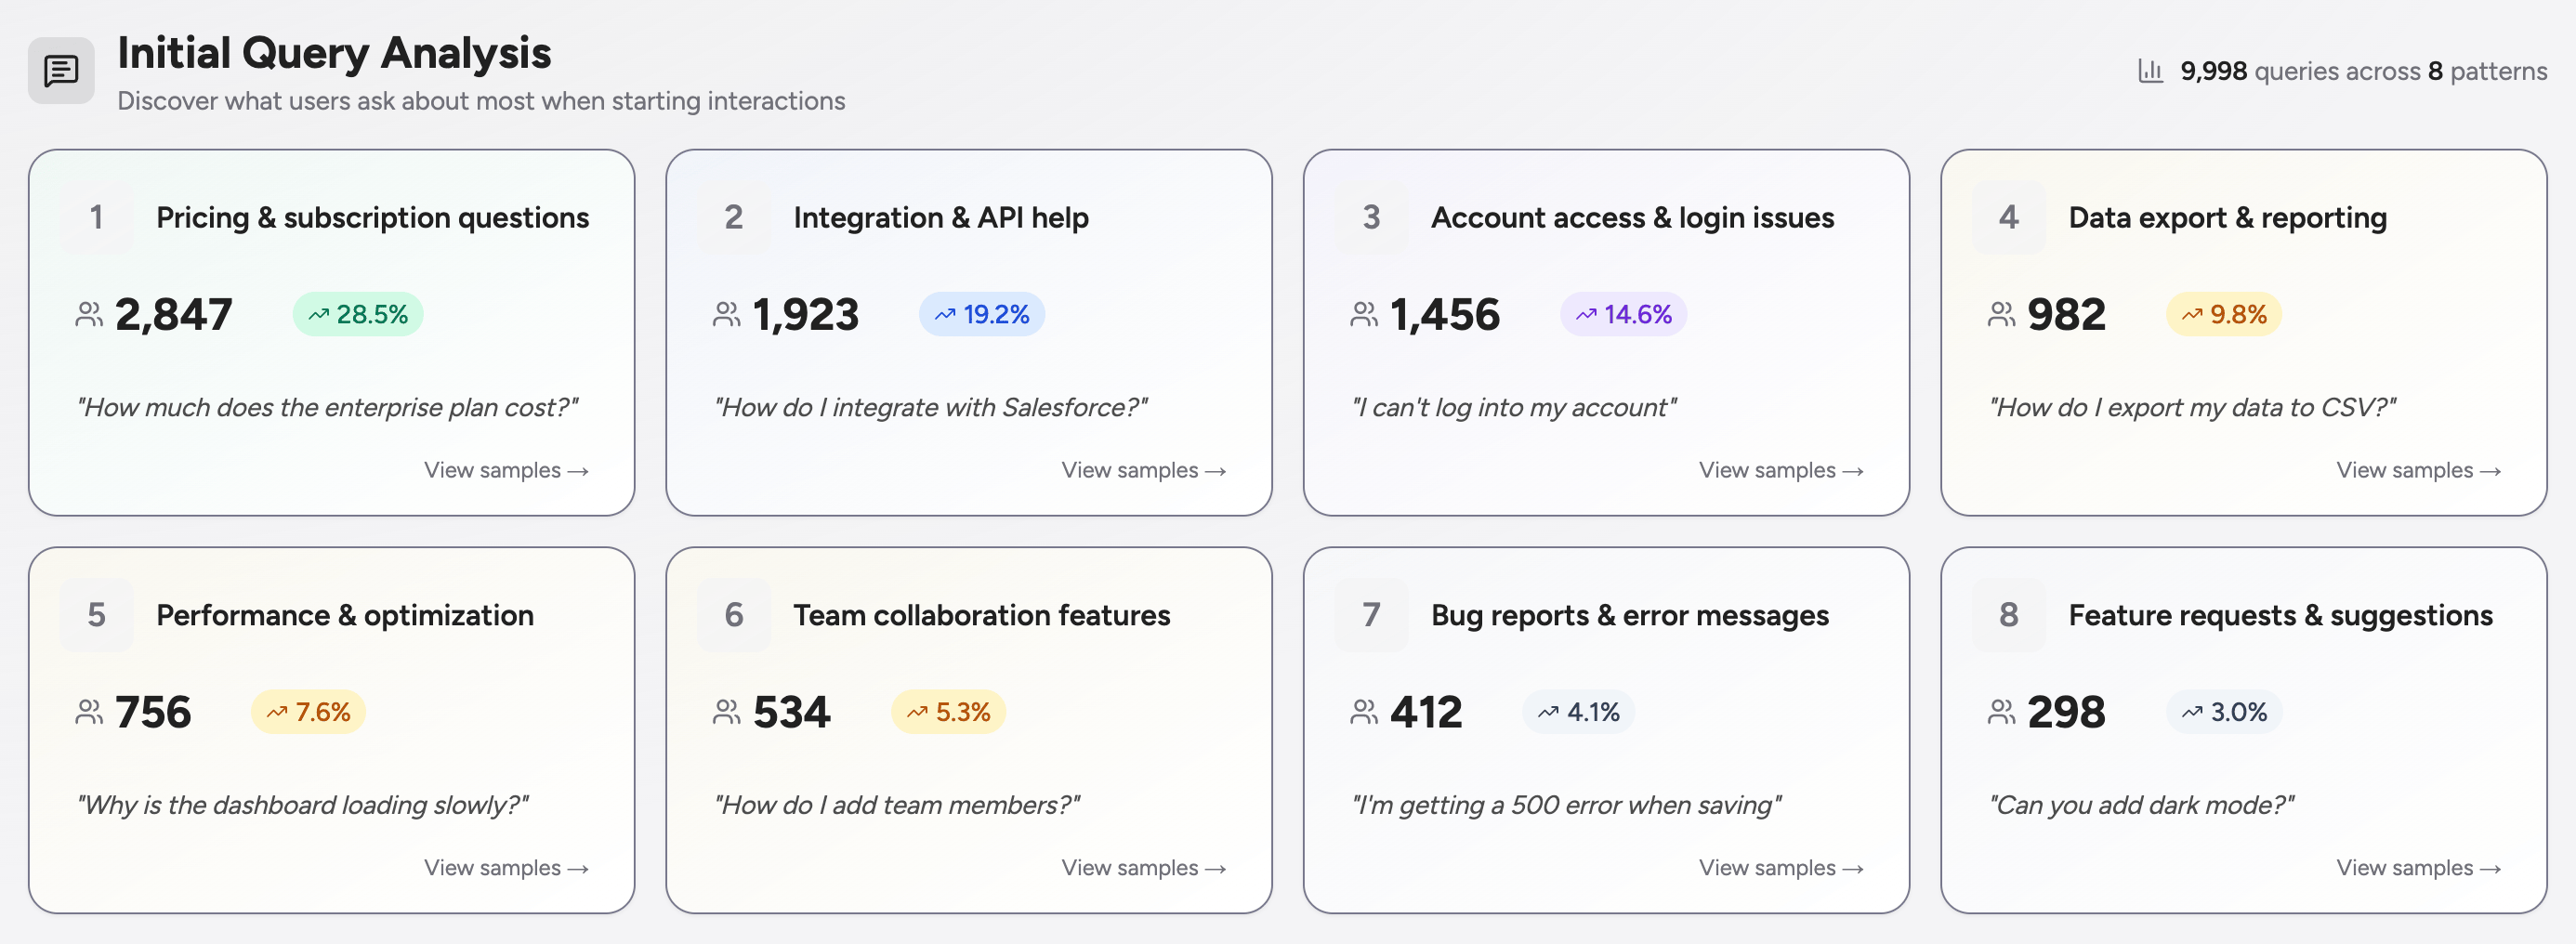
What Brings Users Through the Door?
AI-powered discovery of your users’ most common intents.Greenflash now automatically identifies and groups the most common reasons users start conversations with your AI product. Instead of manually reading through thousands of initial messages, you’ll see clear patterns emerge, each with a descriptive label, prevalence percentage, and real examples from your data.Highlights:- Automatic pattern discovery — Greenflash analyzes every first message and groups similar queries together, revealing what users are actually trying to accomplish.
- Prevalence tracking — See exactly what percentage of users start with each type of query, helping you prioritize product improvements and documentation.
-
Real examples — Click into any pattern to see actual queries from your users, with direct links to the full conversations.
Not Every Request Deserves a Database Row
High volume? Sample it down.Both/messages and /events now support sampleRate and forceSample fields. Set a rate between 0 and 1 to control what percentage gets stored, or use forceSample: true when something absolutely must get through.Messages sample by conversation (all or nothing), events sample individually. Dropped requests return 204 No Content so you know what happened.From Conversation to Conversion
Track the outcomes that matter — then connect them back to the AI interactions that drove them.You can now send business events to Greenflash, linking real-world user actions (signups, upgrades, cancellations) directly to the conversations that preceded them. This closes the loop between AI analytics and actual business impact, transforming quality scores from heuristics into validated, outcome-based metrics.Highlights:- Outcome attribution — Know exactly which conversations led to revenue, retention, or churn by linking events to interactions.
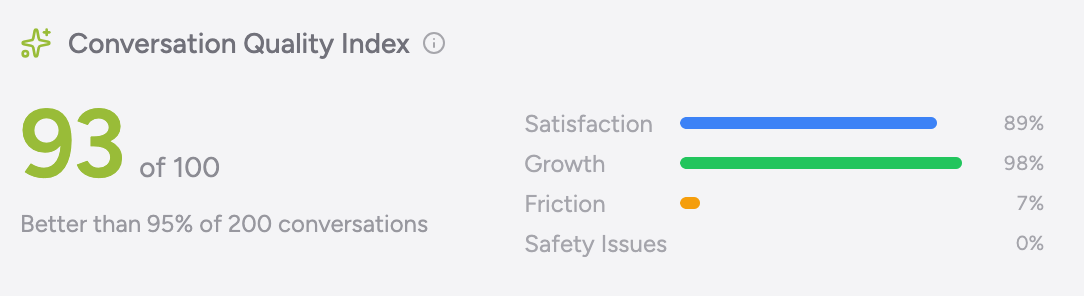
- Event influence scoring — Tag events as
positive,negative, orneutralto feed directly into your Product Quality Index (PQI) and Conversation Quality Index (CQI). - Full metadata support — Attach custom properties, currency values, and contextual details to every event for richer analysis.
- Events API — Send events programmatically from your backend, frontend, or webhooks to track milestones as they happen.
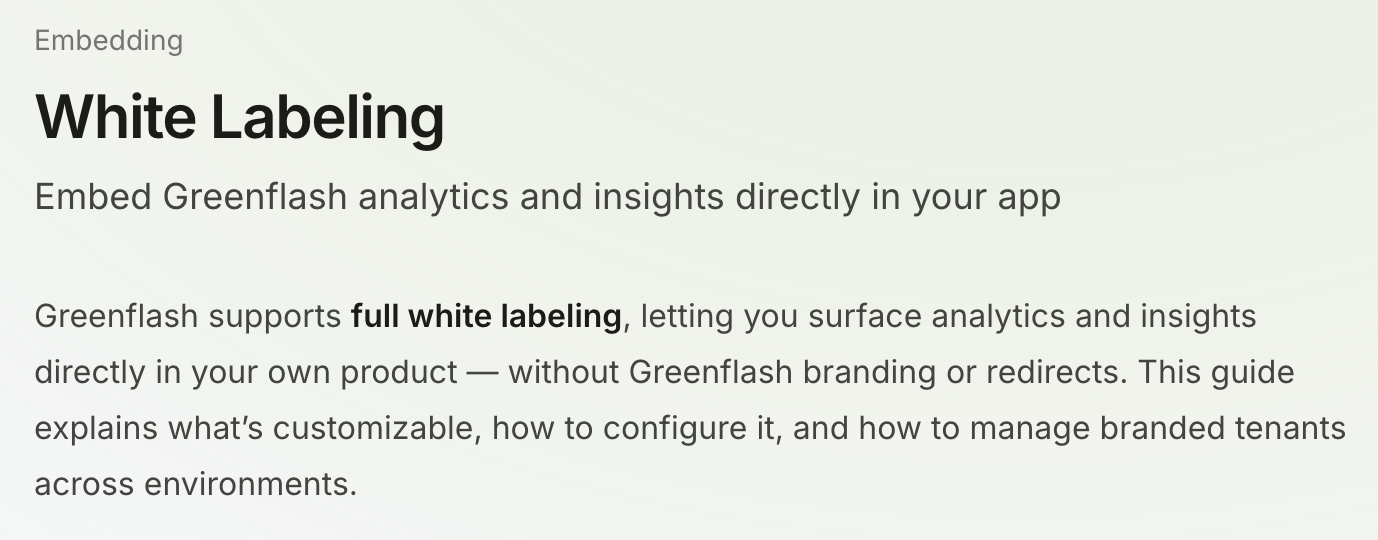
Your Brand, Our Engine
Embed Greenflash analytics directly in your app — no redirects, no branding.Greenflash now supports full white labeling, letting you surface analytics and insights directly in your product under your own brand. Give your customers personalized analytics experiences that feel native to your app while leveraging Greenflash’s infrastructure behind the scenes.Highlights:- Seamless embedding — Deliver user- or organization-specific insights powered by Greenflash, integrated directly into your UI.
- Brand control — Remove all Greenflash branding for a fully native experience.
-
Dual analysis modes — Choose between
simplemode (fast, numeric aggregates, no rate limits) andinsightsmode (deep analysis with topics, keywords, and AI summaries). -
Enterprise-ready — Support tenant-specific domains, custom branding per customer, and isolated analytics environments.
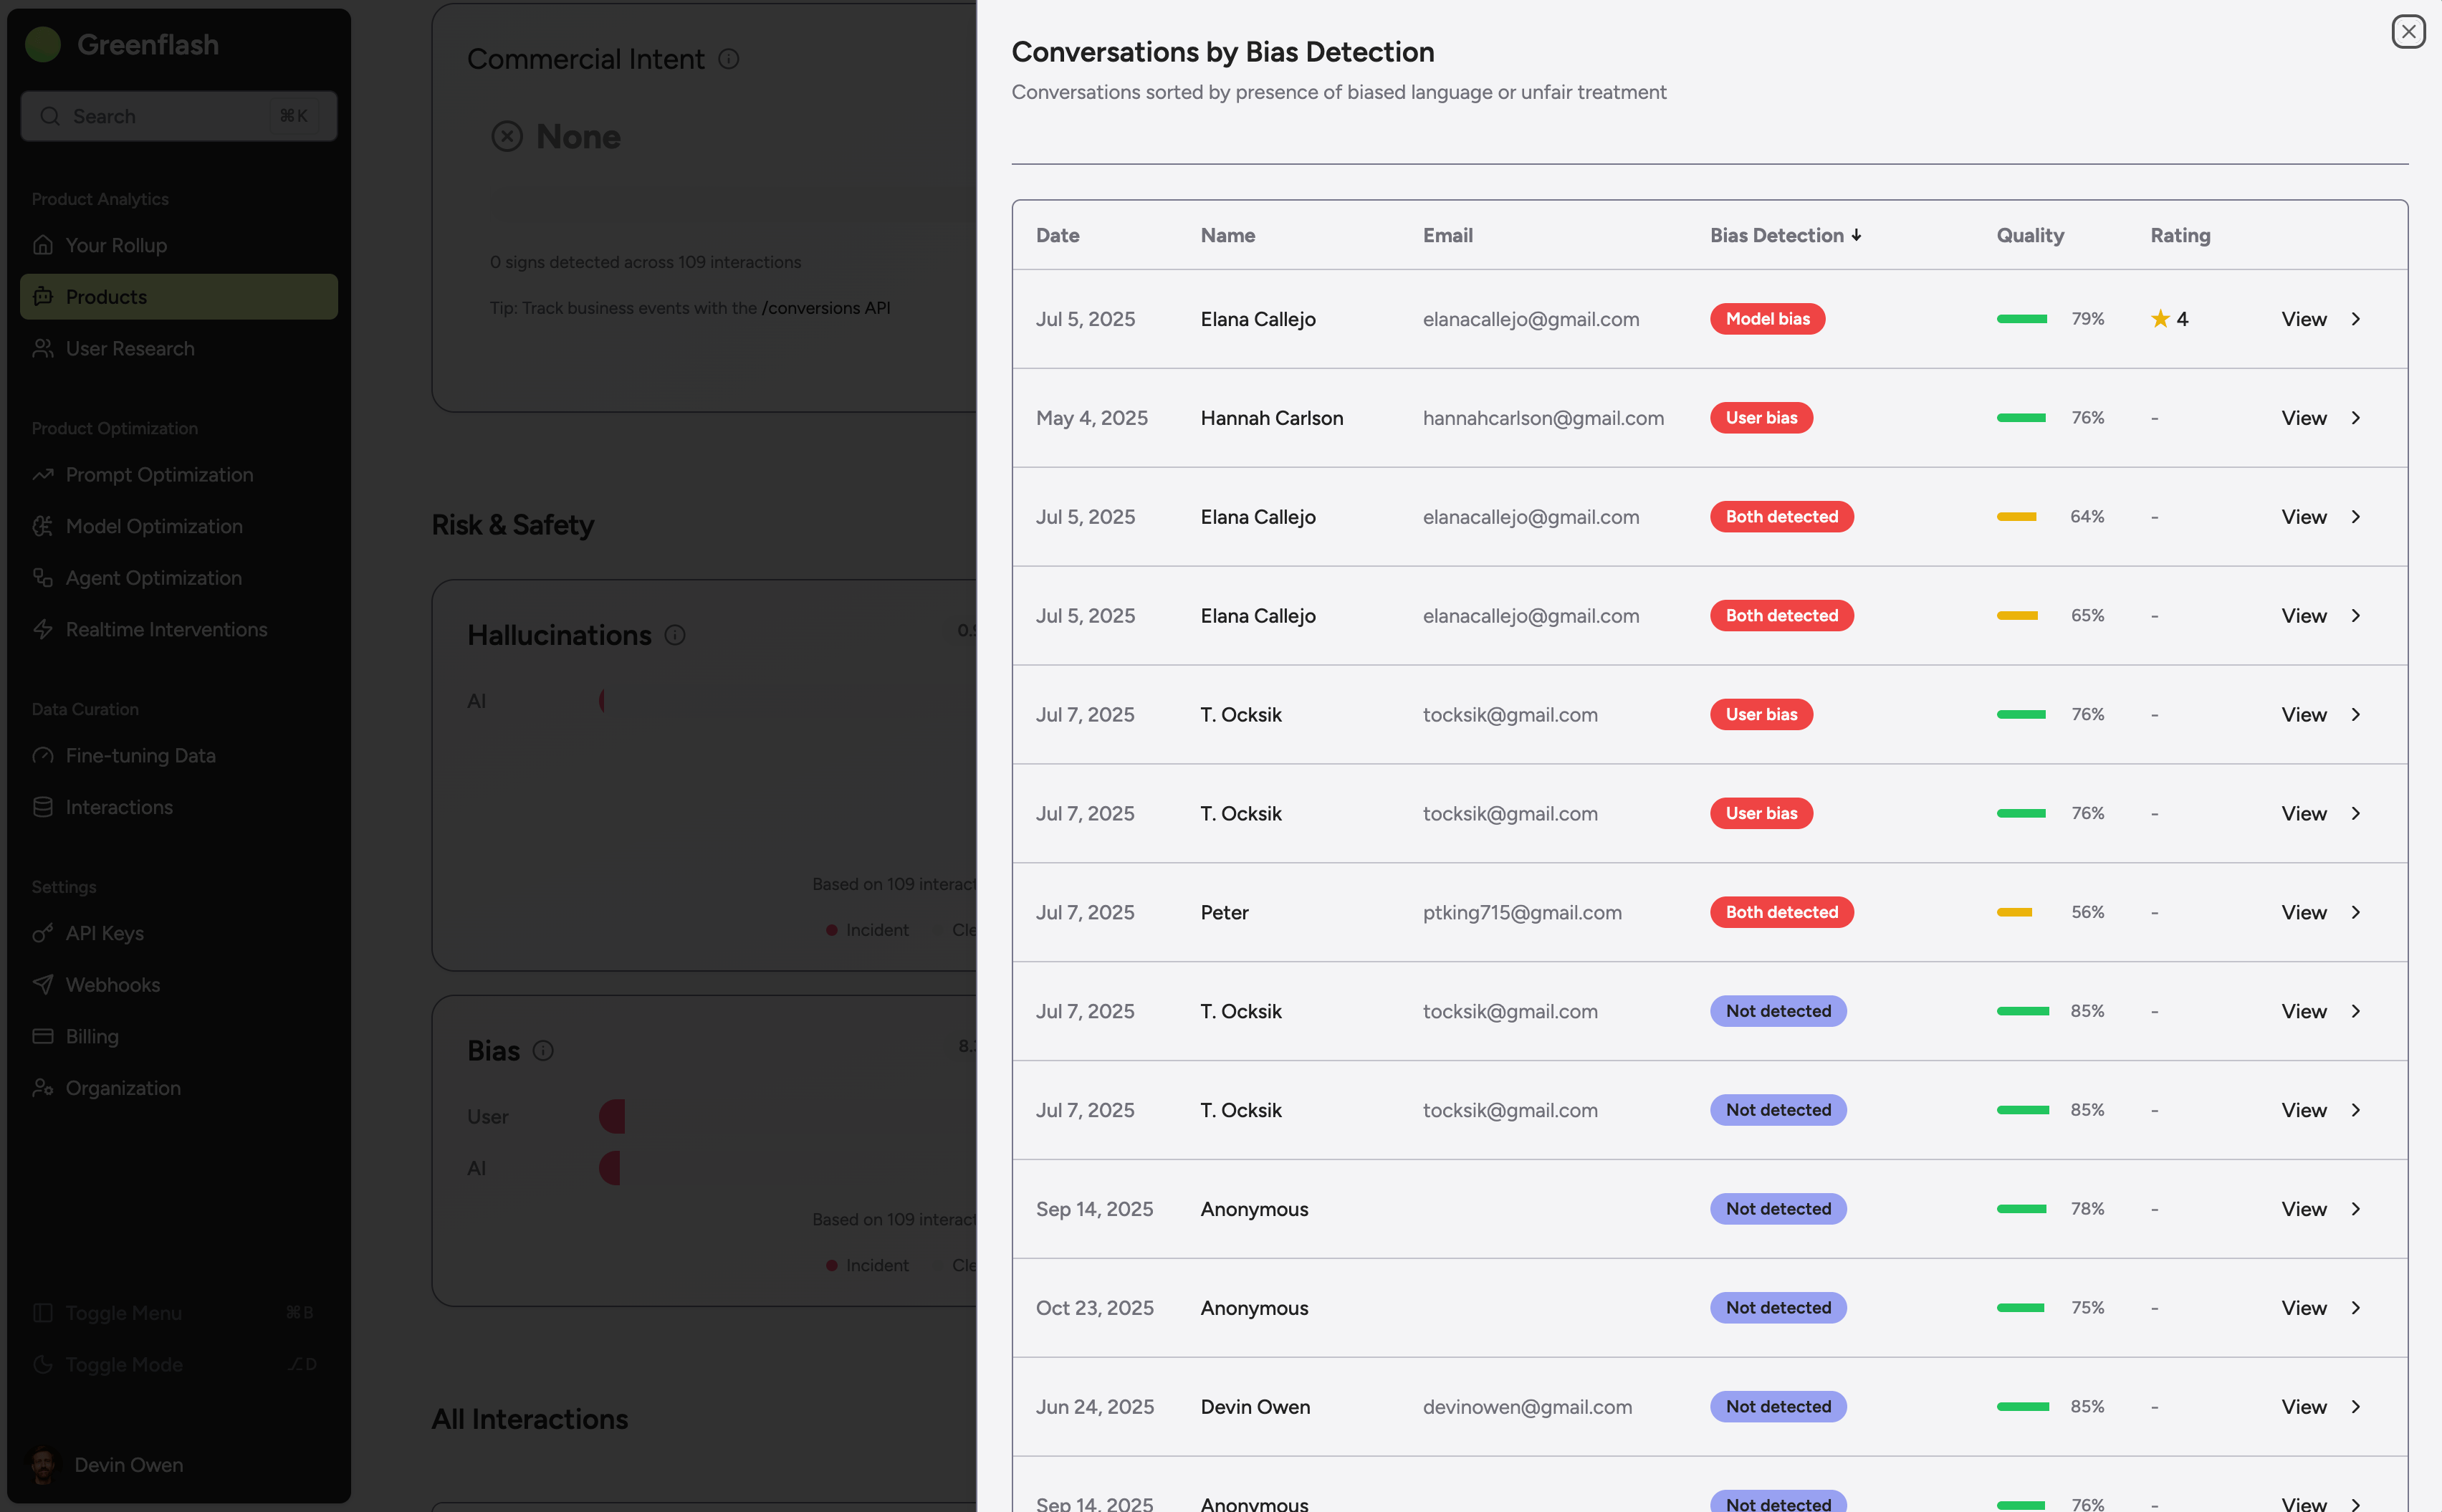
Drill Down to What Matters
Find the conversations that need your attention.You can now drill into any metric to see conversations ranked by that specific dimension — whether it’s frustration, struggle, quality, or any custom analysis. Click through from charts and dashboards to instantly surface the interactions you care about most.We’ve also added rich visualizations for topic and keyword analyses, making it easier to spot patterns and understand what your users are really talking about.Highlights:- Metric-based drill downs — Click any metric to view conversations ranked by that score, filtered to your current context.
- Instant context — Jump from aggregate analytics straight to the source conversations driving those numbers.
- Topic & keyword charts — New visualizations show topic distributions, topic group trends, and keyword frequency over time.
-
Smarter exploration — Find outliers, track recurring themes, and identify conversations that warrant deeper investigation.
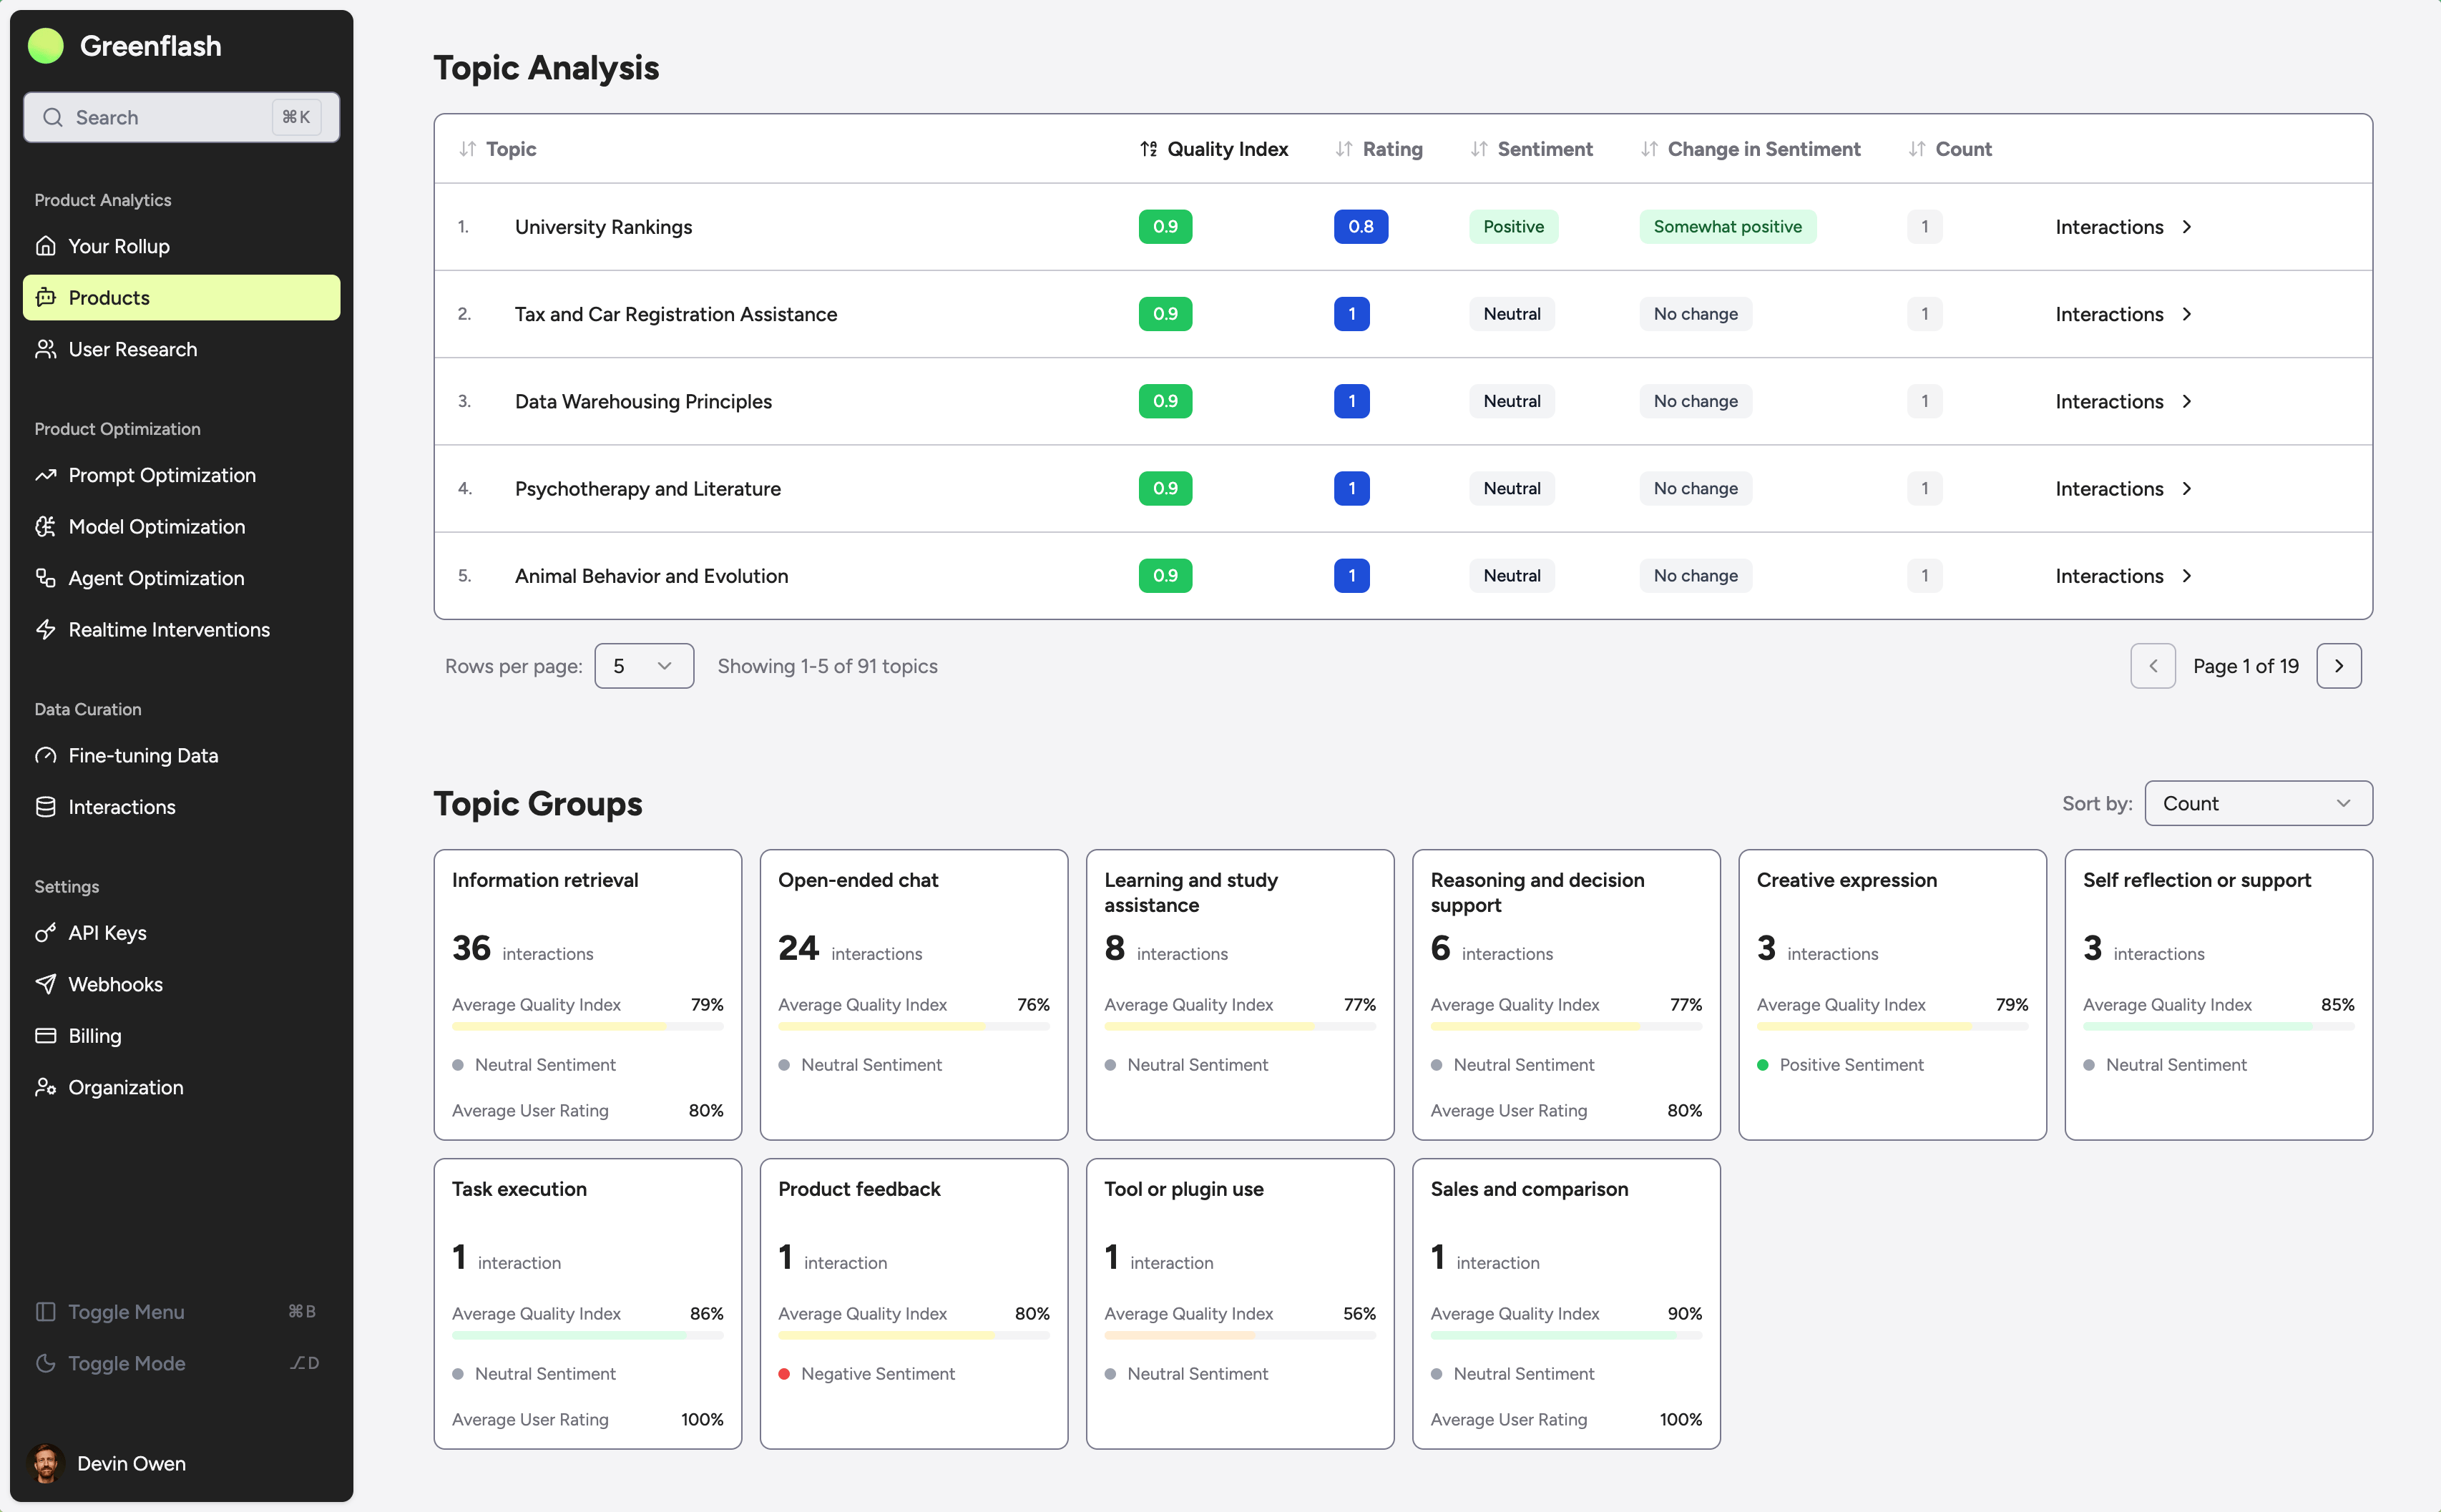
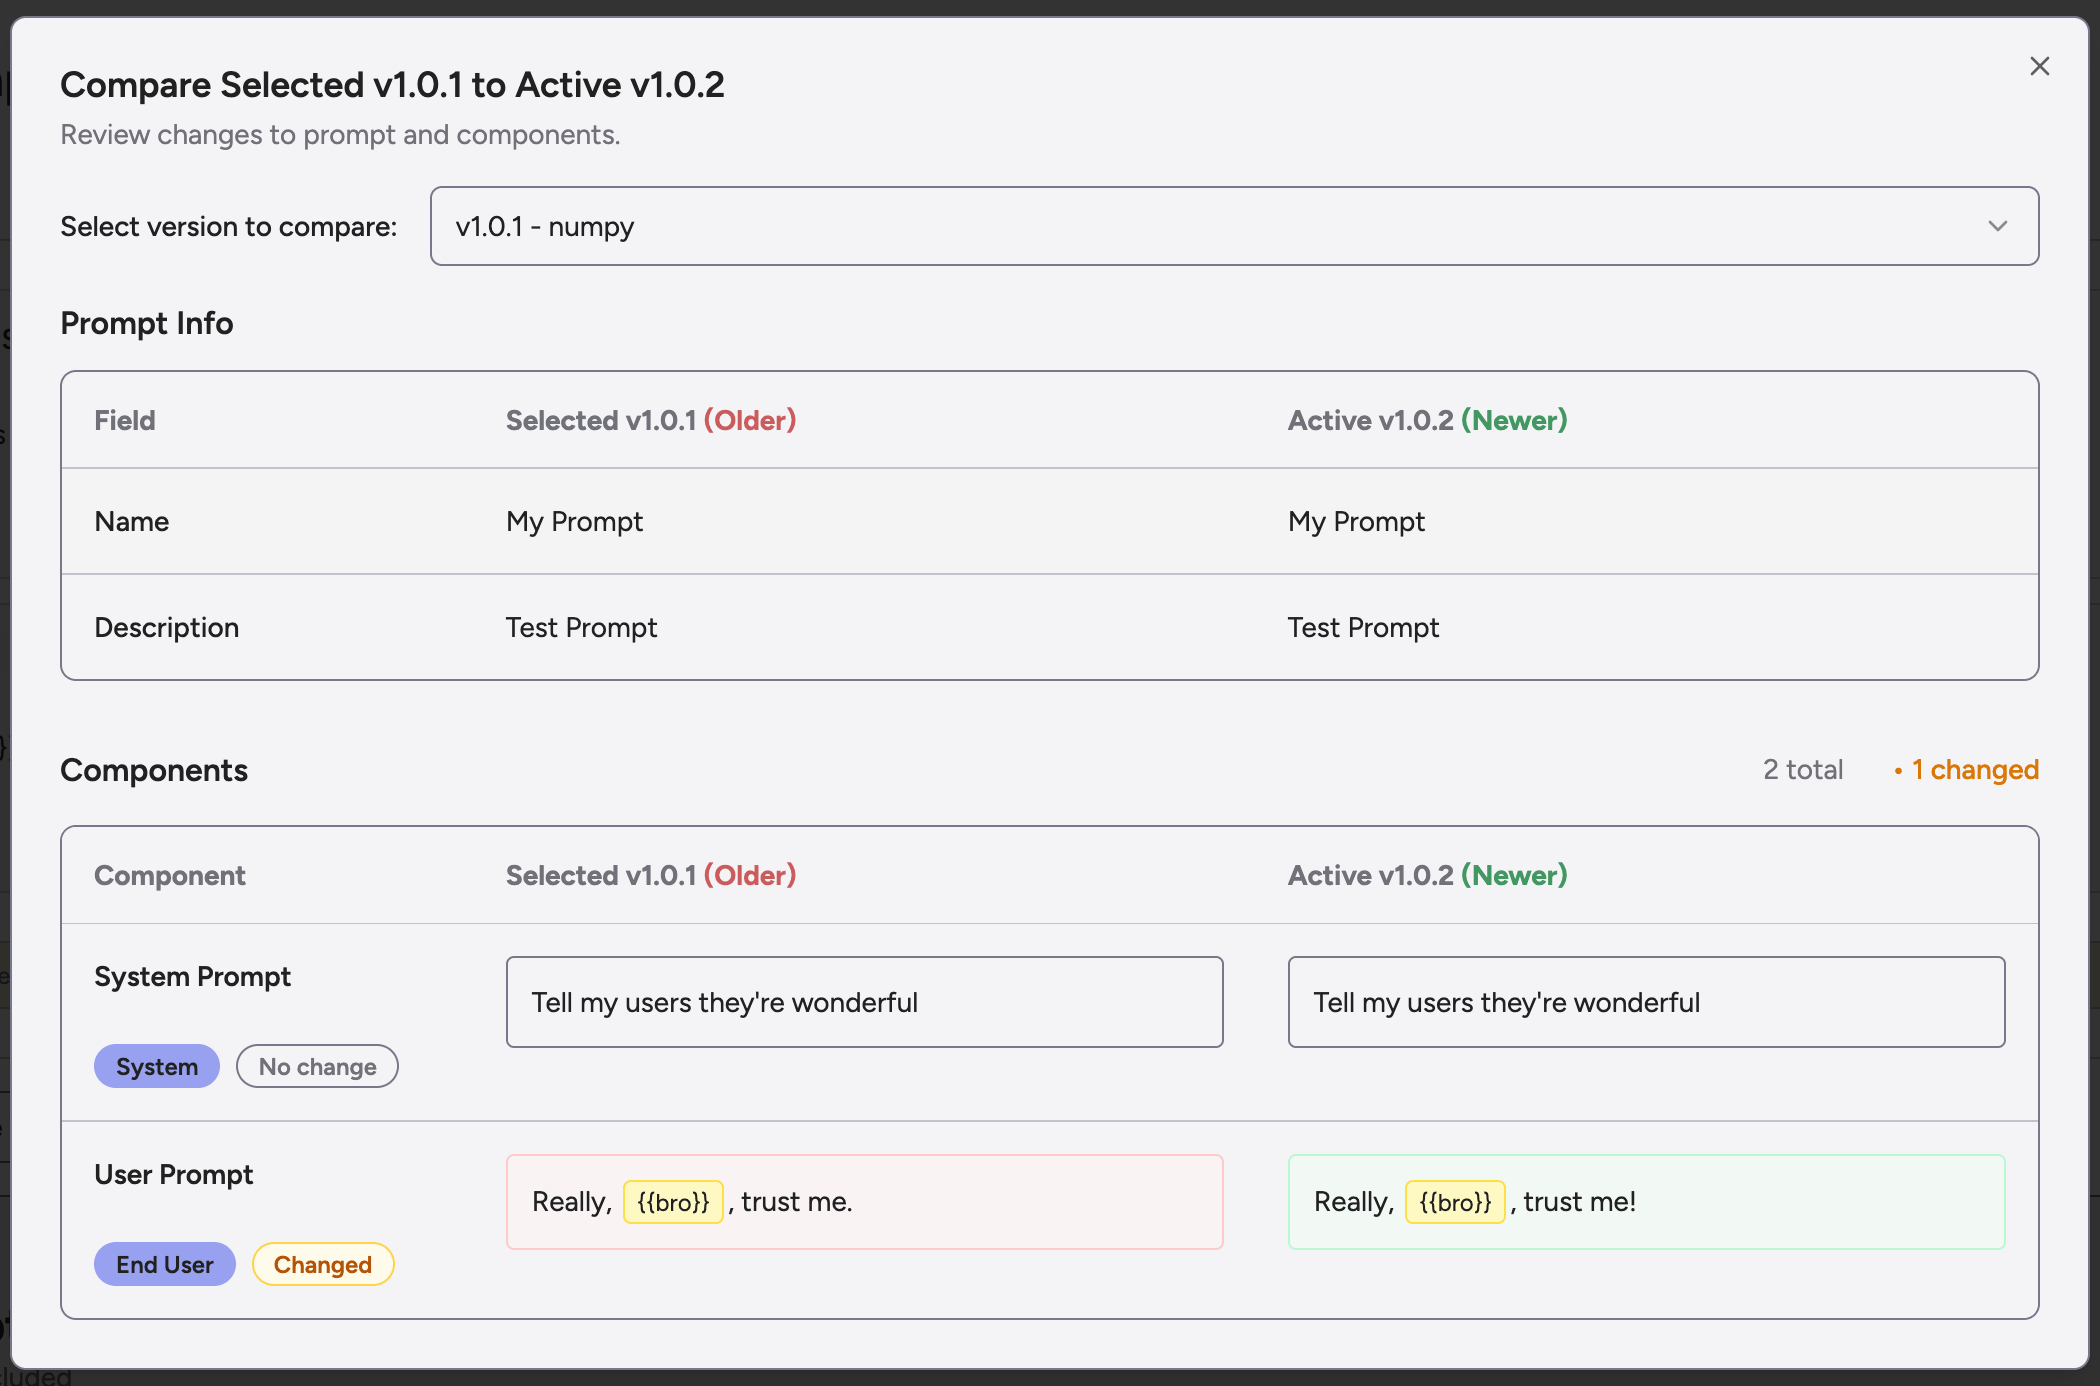
Prompts Got a Memory (and an API)
Immutable, traceable, and finally versioned like grown-ups.Prompts are now fully versioned with lineage tracking, intelligent fingerprinting, and a new /v1/system-prompts API. You can diff versions, follow their family tree, and ensure history is never lost or overwritten.Highlights:- Lineage tracking — Every prompt now inherits a versioned history you can trace across deployments and libraries.
- True immutability — Prompts, components, and versions are write-once snapshots for complete reproducibility.
- Fingerprinting — Identical prompts automatically share a version, eliminating duplication.
-
System Prompt APIs — Create, list, update, and delete prompts programmatically with variable interpolation (
{{variable_name}}) and metadata support. -
Refreshed UI — Compare versions side-by-side, view components, and see exactly what changed and when.
Let the Data Speak (Louder and Faster)
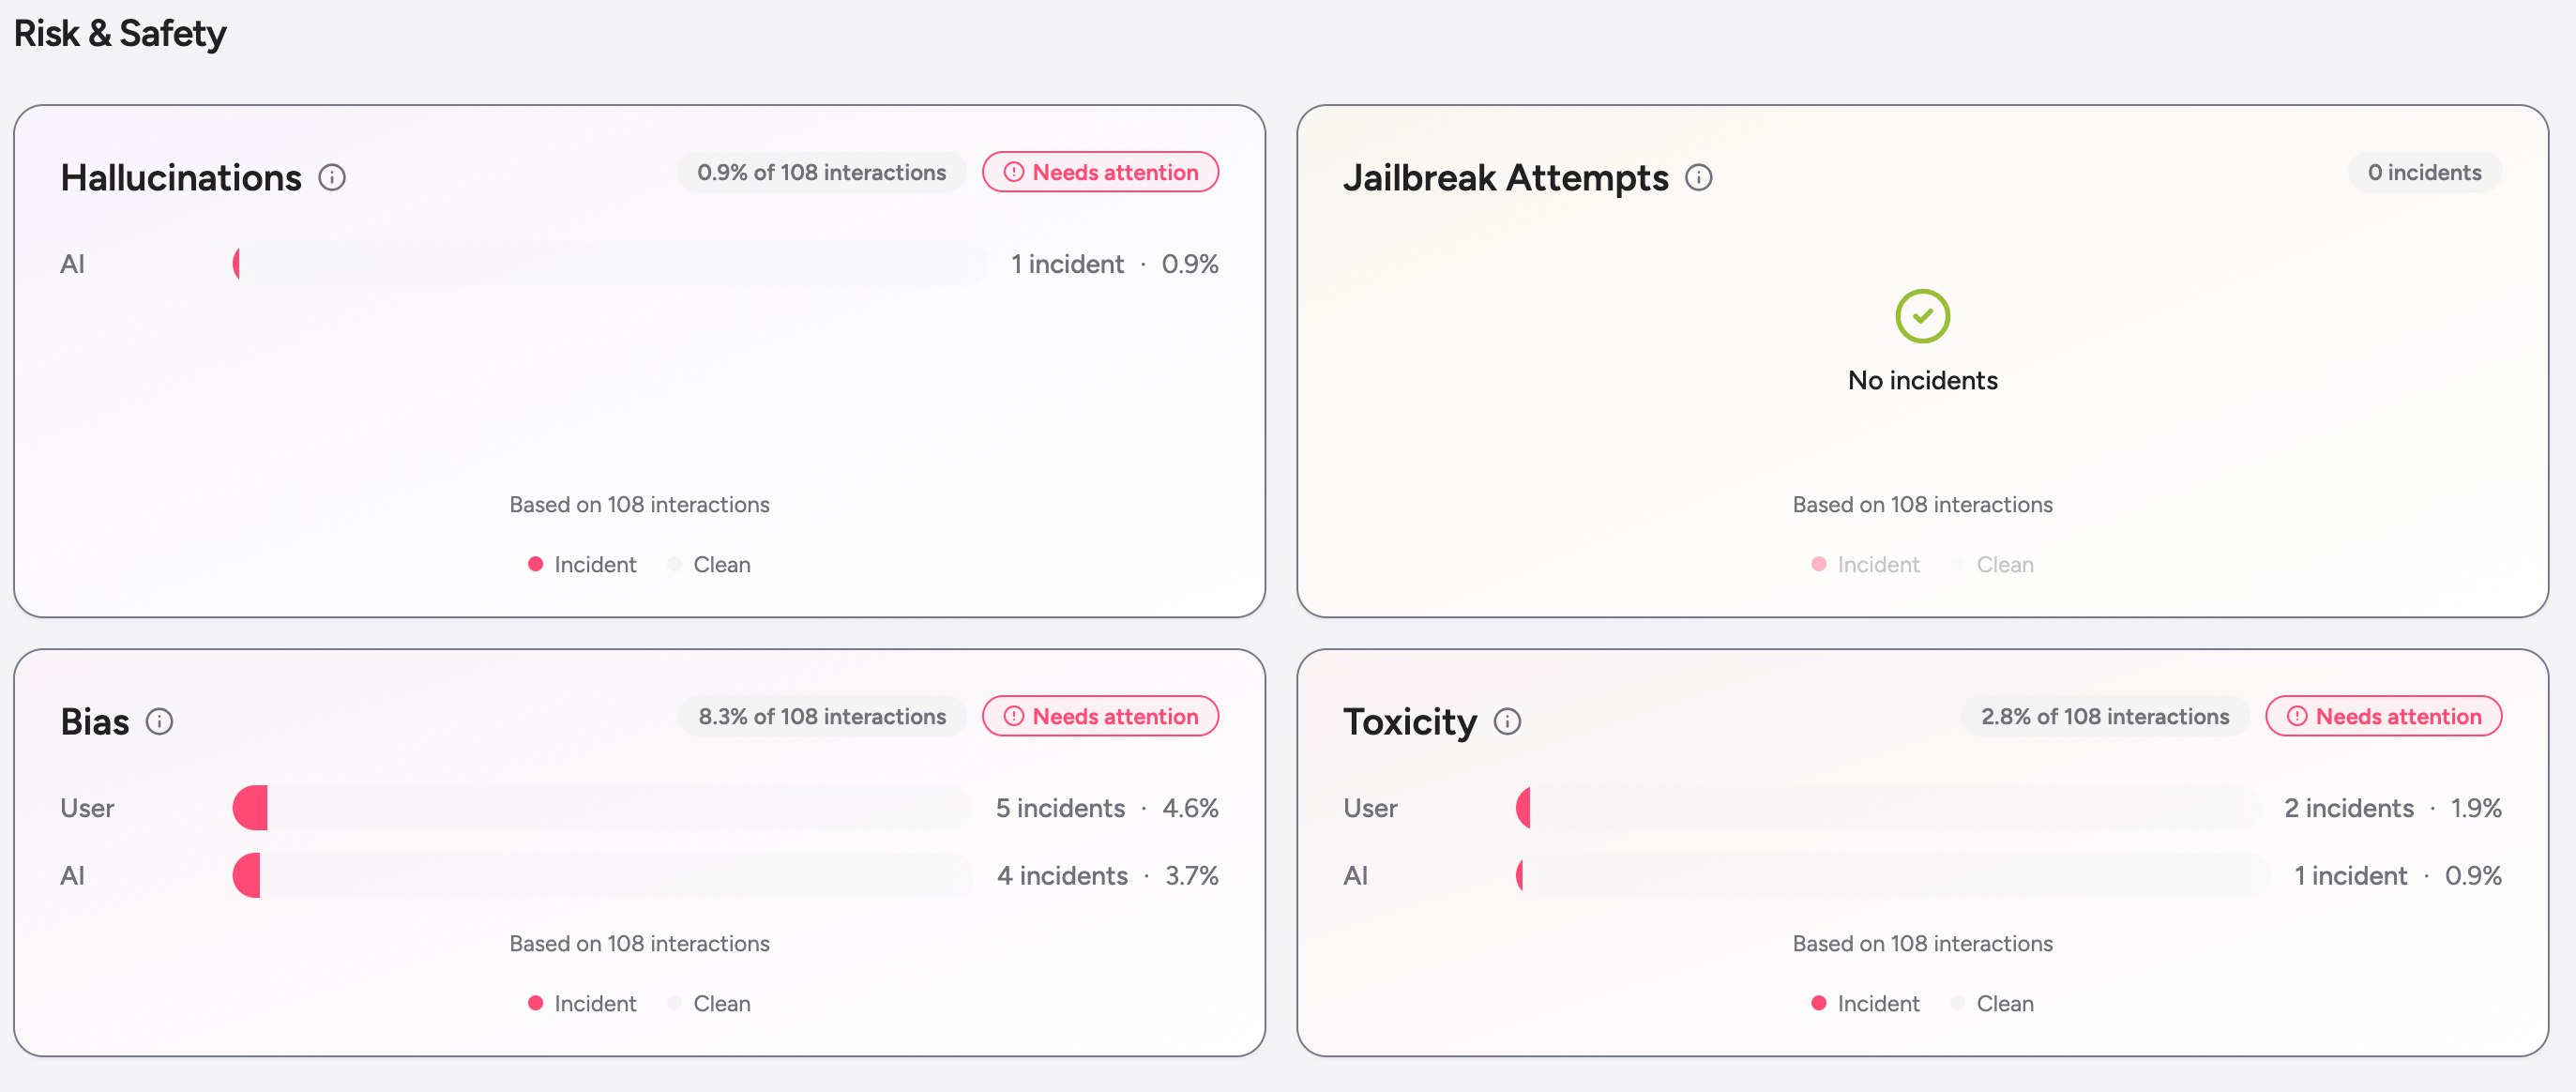
Analytics that scale with your customers.Analytics now support tenant-level insights, product and version segmentation, and faster queries across the board. Pages reload instantly, letting you explore insights without waiting.We also redesigned the interaction analysis cards for greater clarity. Metrics are now grouped into User Experience and Risk & Safety sections, with improved hierarchy, color cues, and inline sample-size indicators for quick interpretation.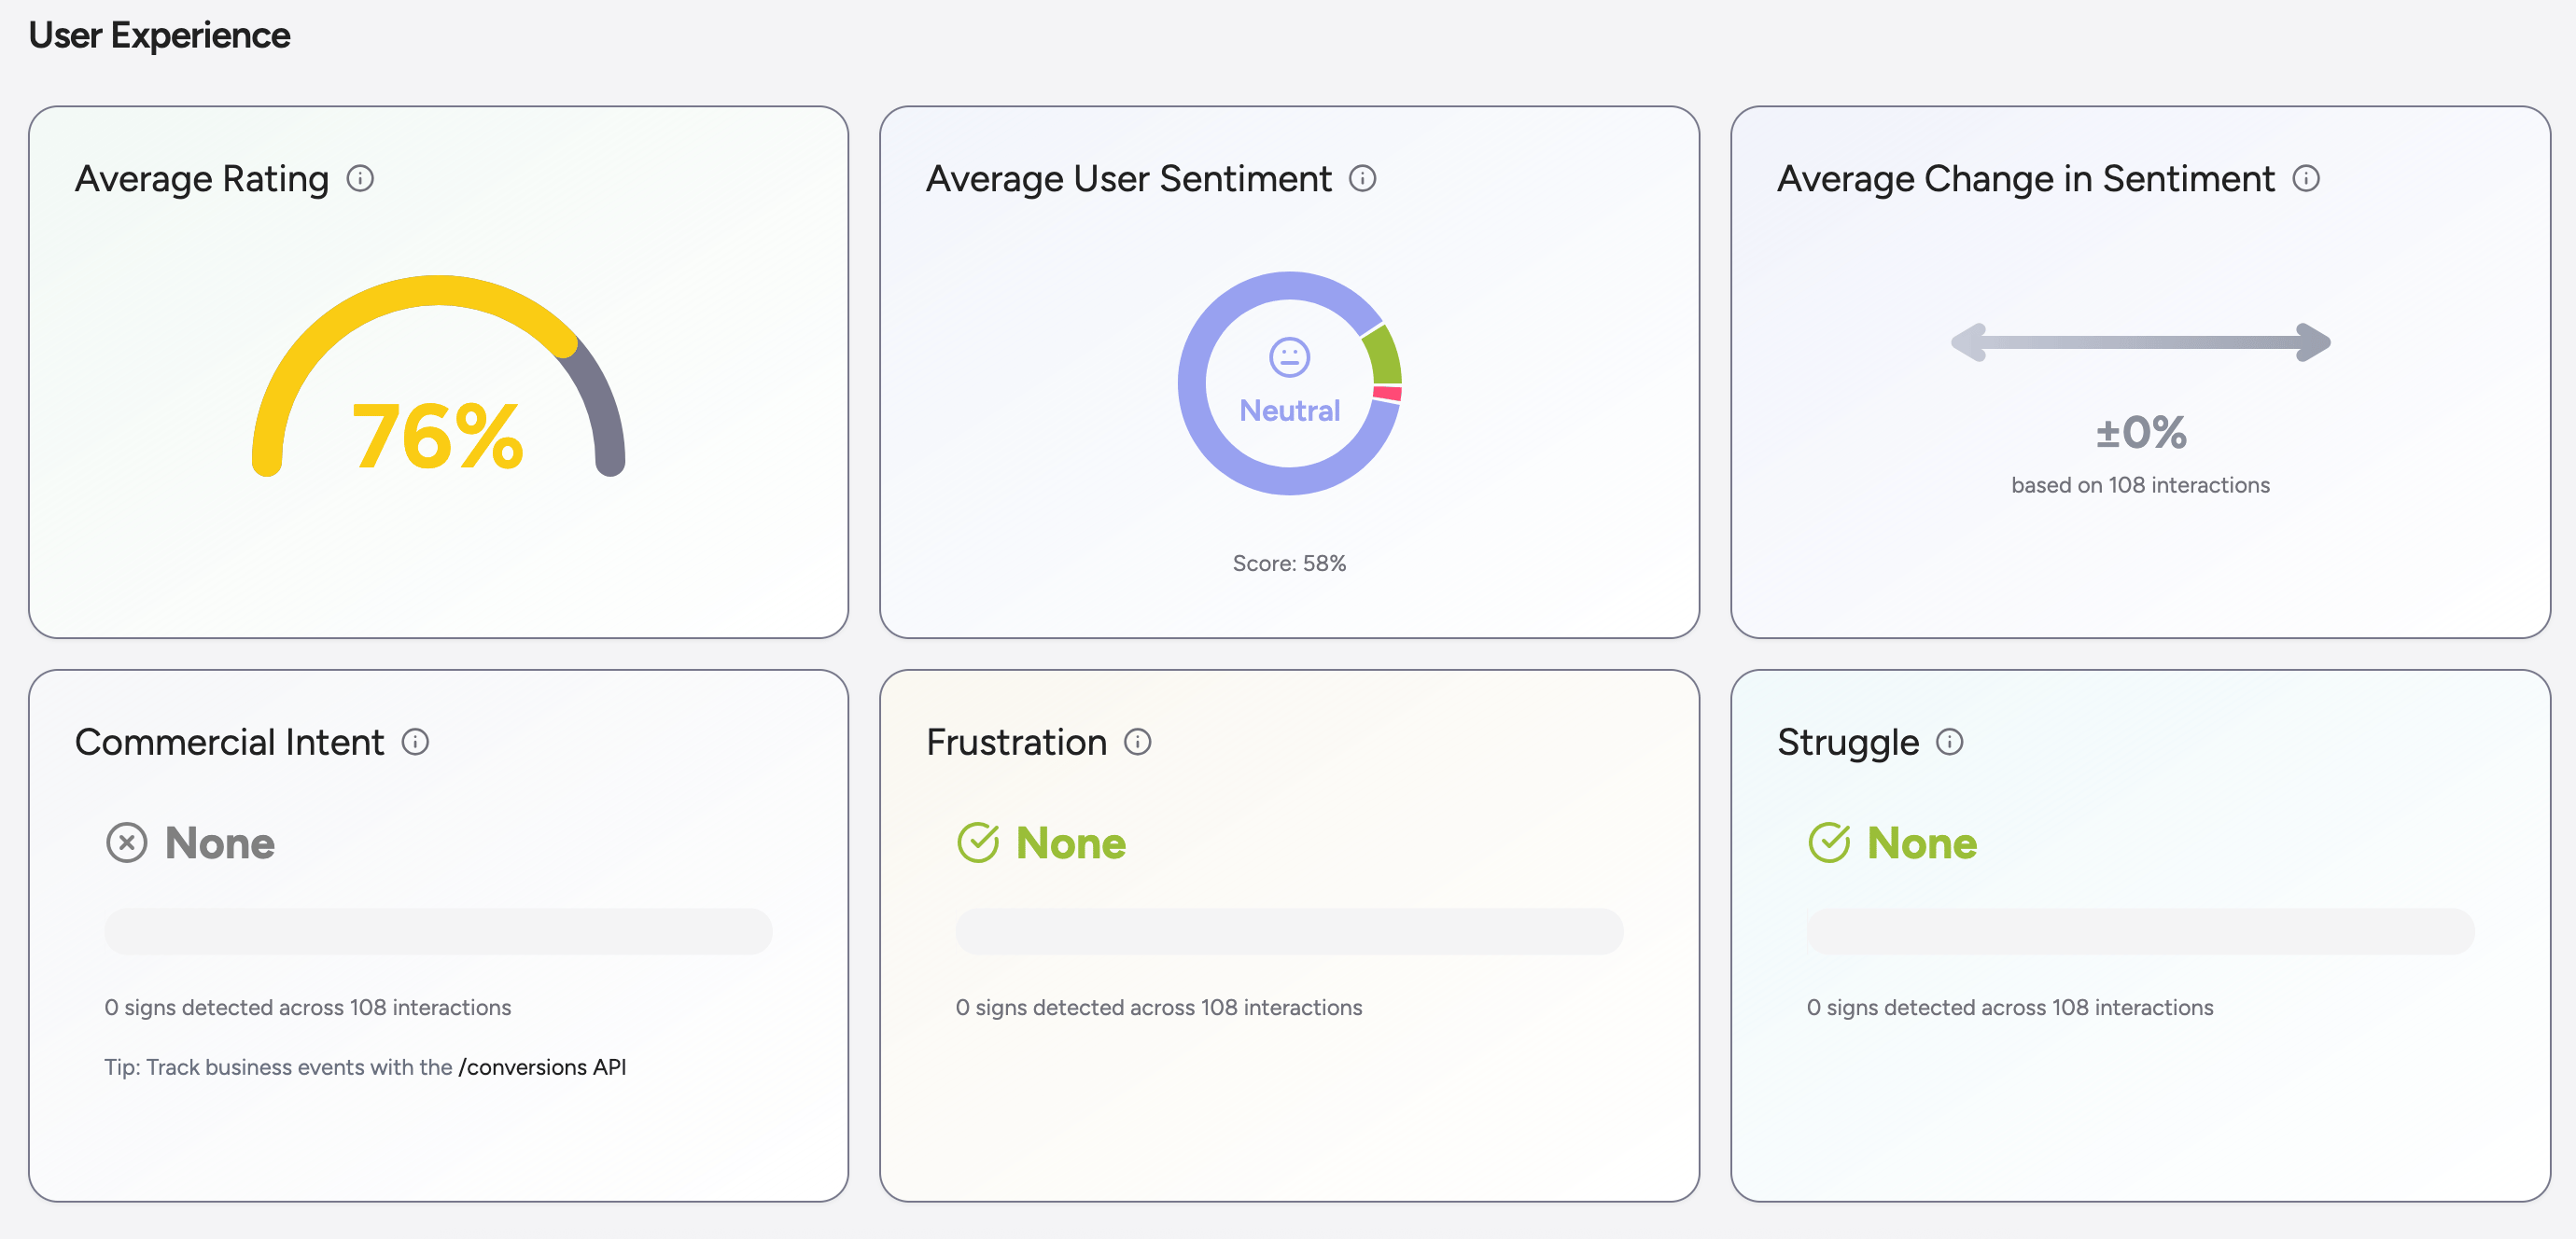
Your Users Have Feelings — Now Quantified
Frustration, struggle, and intent scores for every conversation.Each conversation now includes new analyses for frustration, struggle, and commercial intent, helping you understand user sentiment and motivation in real time. These scores also integrate with webhook events so you can act immediately when thresholds are crossed.At the product level, Greenflash now analyzes initial queries to reveal the most common reasons users start conversations — showing what truly brings them through the door.Webhooks That Actually Work
Real-time visibility for everything that matters.Subscribe to events likeconversation.analyzed or message.created to receive signed payloads whenever key activity occurs.
You can configure multiple endpoints, test deliveries, and monitor status per endpoint for full transparency.Security is built in: every webhook is signed and validated with per-endpoint secrets.Who’s Who: Identification APIs
Bring structure to your users and organizations.New endpoints make it simple to manage users and organizations:POST /users, PUT /users/{userId}, POST /organizations, and PUT /organizations/{organizationId}.
All support idempotent upserts and can link through /messages to tie conversations back to the right customer.The user and organization tables also received a layout refresh for improved readability and hierarchy.Meet Organizations (and Nicer Charts)
- Track your customers, visualize your impact. *
Custom Analyses + Friendly Onboarding
A faster path from setup to insight.Getting started is now more intuitive. You’ll see sample data, milestone tracking, and guided steps that make the first analysis effortless.You can also define custom analyses directly in settings to evaluate interactions based on your own hypotheses and metrics. Greenflash automatically processes them and visualizes the results for deeper insight.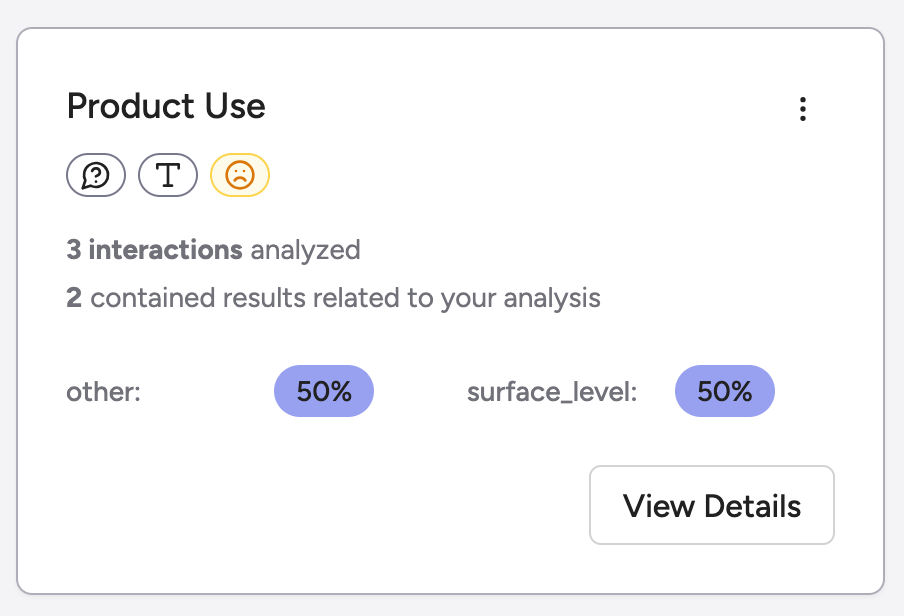
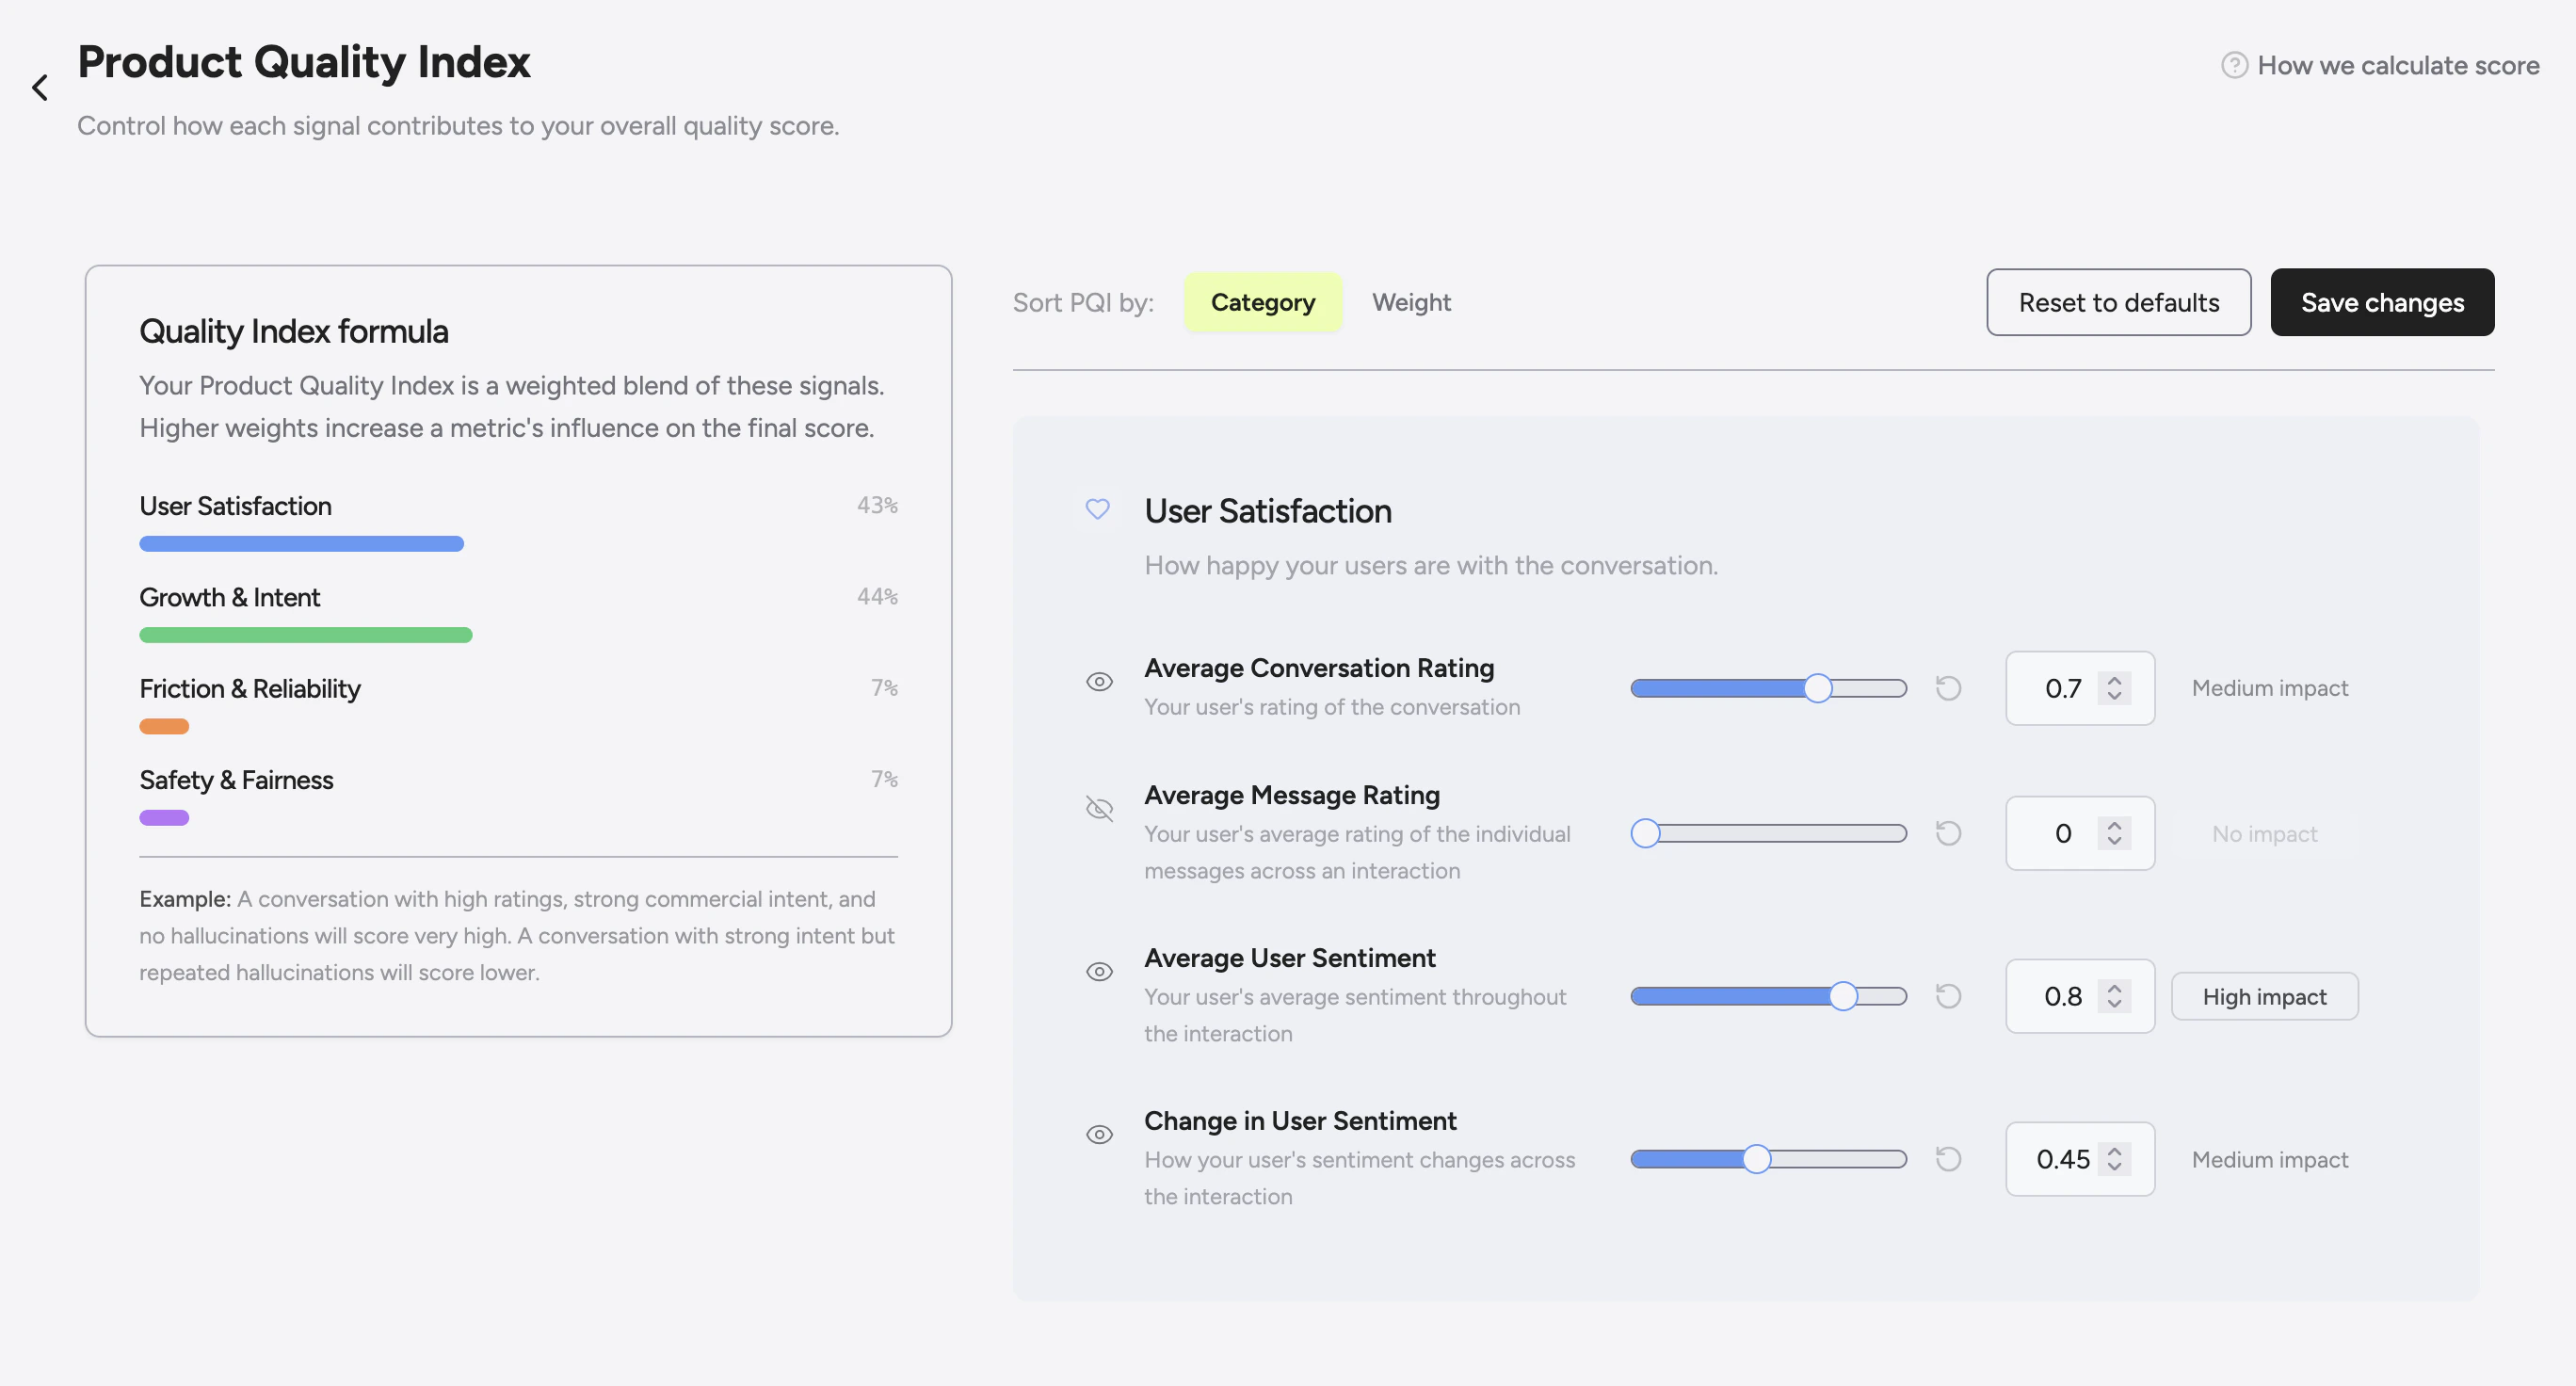
PQI, Now with Personal Taste
Customize how quality is measured.You can now configure your Product Quality Index (PQI) by selecting which components matter most and adjusting their weights. Your custom formula updates every chart, dashboard, and analytics view in real time.We also improved conversation scoring and added automatic refreshes for interaction pages when analyses complete.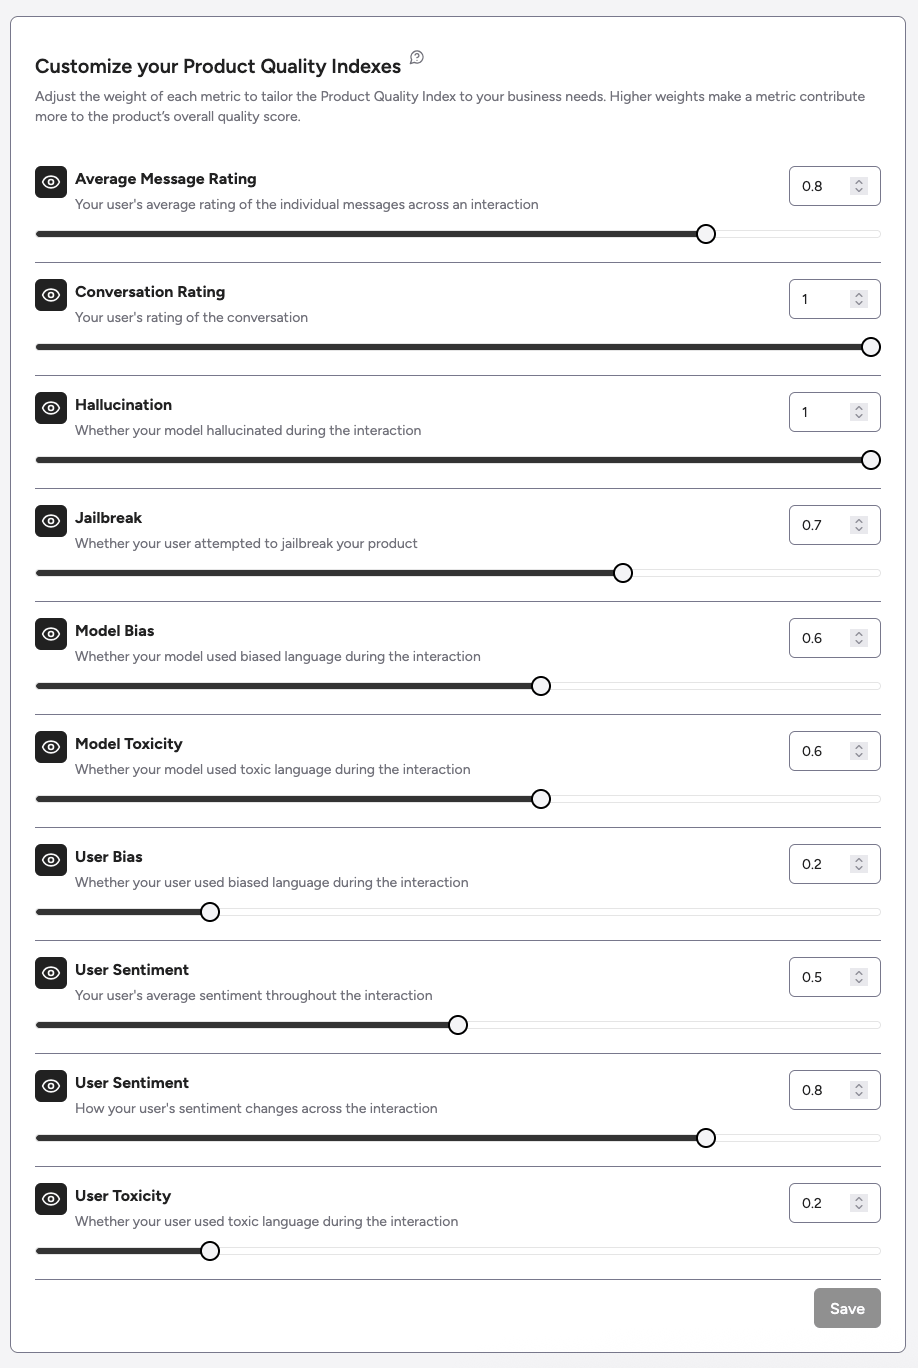
API Errors, But Make Them Helpful
Readable messages, consistent responses.Error handling is now clearer and more consistent across the API. Status codes are standardized, and validation errors explain exactly what needs fixing — making debugging faster and less frustrating.
Product Filters Everywhere
Focus on the product that matters.You can now filter dashboards, interaction lists, and analytics views by product. Every view respects your selected scope, giving you focused insights without cross-product noise.Open For Business
The gates are down.Early access is over. Sign up for an account, grab your API keys, and start sending data: no waitlist, no approvals. We also streamlined the onboarding experience so you can get to insights faster.Better Analytics!
What’s better than knowing your product quality today? Knowing how it’s been doing over time.Now you can chart historical PQI scores with a time range of your choice.Agents Are First-Class Citizens
Agents talk too — now we track them. See every step in your agent’s thought process before it makes a move.Also: rollup and product page got a speed boost.(Don’t) Build a Wall!
Row-level security is now on across the app, so only you (and your team) can see your data.Early Access
Greenflash is live in early access! Want in? Visit our homepage or drop us a note at [email protected].Status Page + API Support
Check our status page for real-time updates.You can also send anexternalMessageId to /messages to link your messages to ours.New, Shiny (and Stainless) SDKs
Hook up Greenflash with our TypeScript or Python SDKs.They’re OAS-backed and wired into our public APIs via zod. Need another language? Email [email protected].Welcome to Greenflash!